METRICAL:Reason Behind the Difference in Management Between Family Companies and Others Is the Shareholding

On October 14, the Nikkei Shimbun published an article titled “The Magnetism of “Founder’s Family Companies with Reverse Strategies”: Aggressive Even in a Crisis, Corporate Governance is an Issue.” I would like to think about the points discussed in the article.

The October 14 Nikkei article outlined the following report.
Founding family companies that did not flinch in the face of the crisis and moved to a “reverse strategy” are attracting investors. Companies that made quick management decisions and expanded store openings during the COVID-19 pandemic have been unique in the stock market because of the explosive power of their earnings recovery. Weak governance, which has been a longstanding issue, has also been addressed, and money is flocking to companies that are ahead of the curve.

The Nikkei Stock Average rebounded sharply in the Tokyo market on October 14, ending the day 853 yen higher than the previous day. Compared to the end of last year, it was 6% lower. The market environment remained nervous due to strong concerns about continued U.S. interest rate hikes and economic recession. One company that has seen its share price rise steadily and more than double its appreciation rate is TKP, a major rental meeting room company. In FY02/2021, when face-to-face events decreased due to the Corona disaster, the company fell into the red for the first time since its listing. While reducing fixed costs such as personnel expenses and rent, the company remained on the offensive behind the scenes. The company aggressively purchased prime properties that were undervalued. This “reverse management strategy” is now bearing fruit. With the lifting of restrictions on activities, demand has returned, and the company is back in the black for the March-August period of 2022 for the first time in 3 years. President Takateru Kono, speaking at the October 13 financial results briefing, enthusiastically stated, “We will not only rent out space, but also provide content (such as distribution services) to increase added value.”

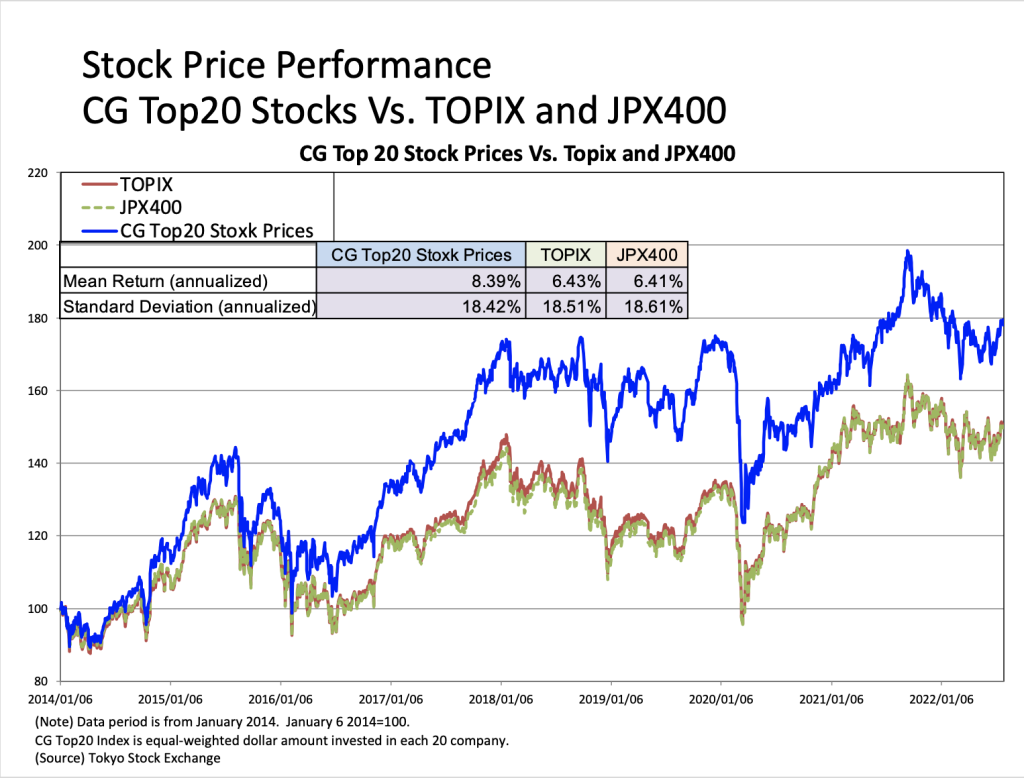
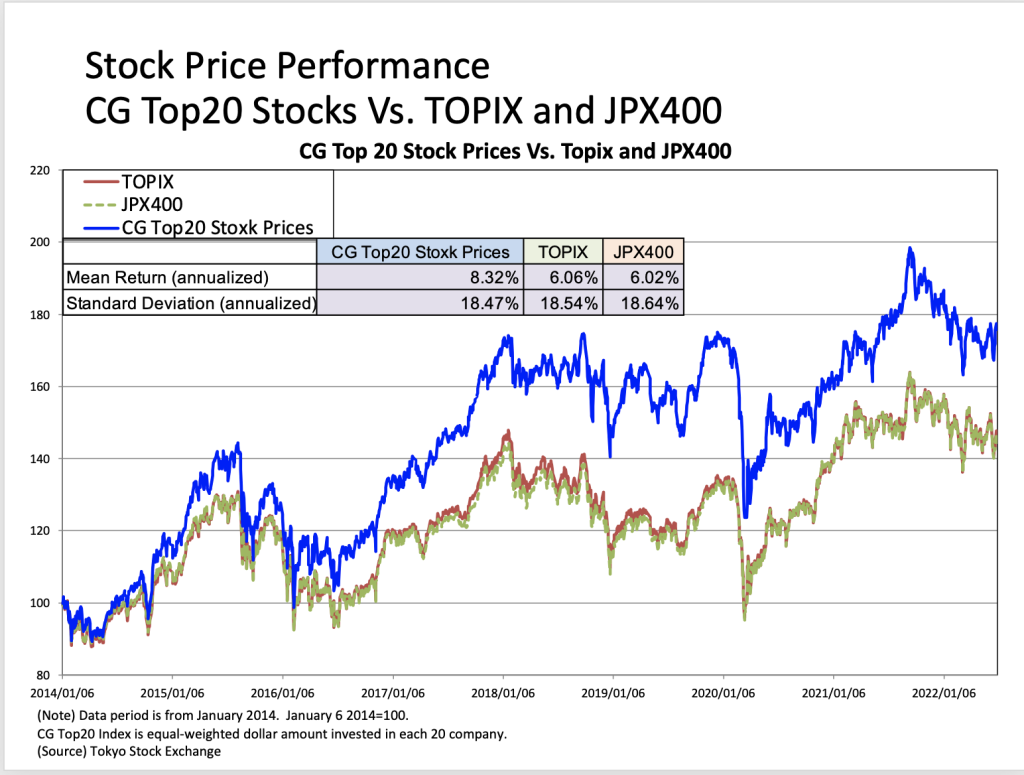
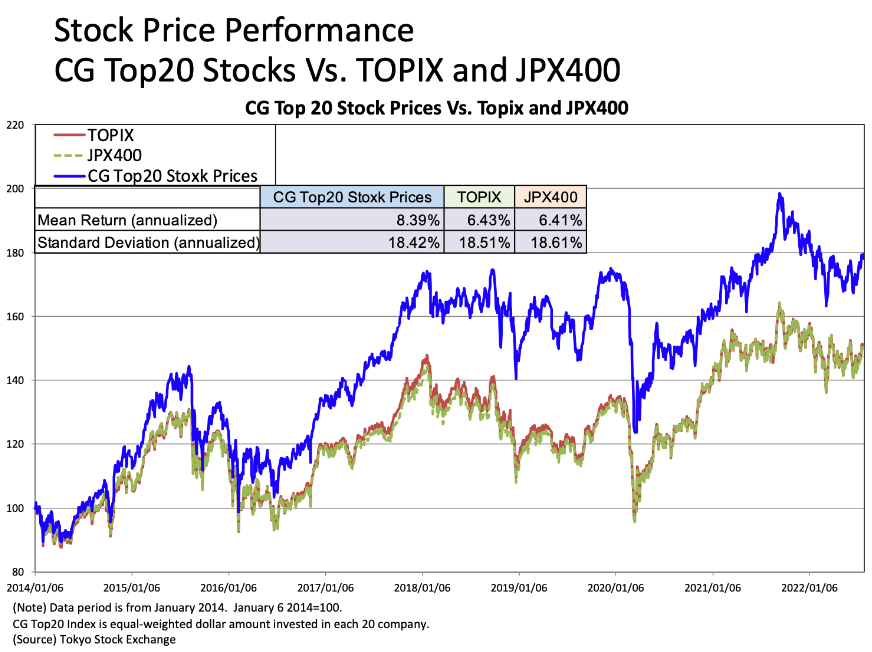
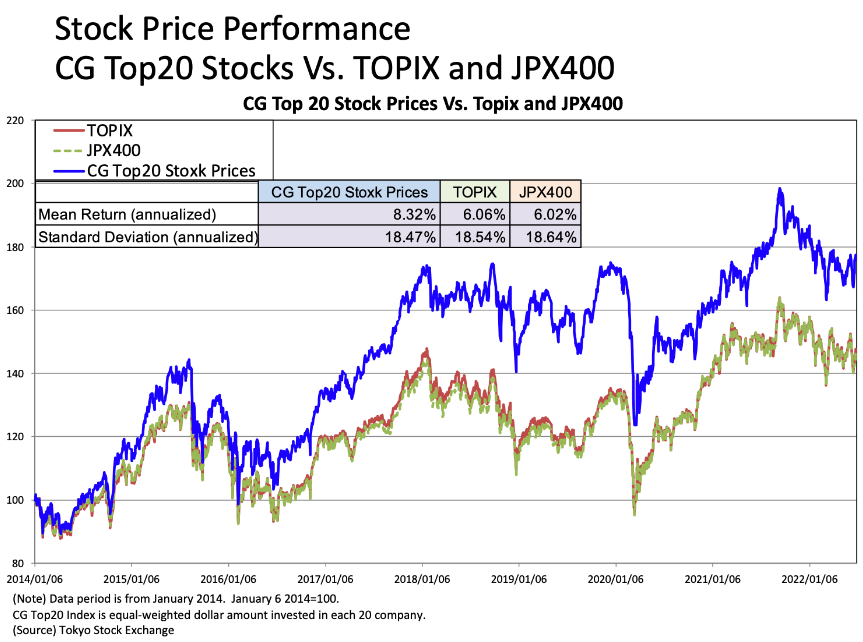
CG Top 20 Stock Performance (October 2022)

The stock market closed higher in October, driven by rising U.S. equity prices, which rose on expectations of a slowdown in U.S. policy rate hikes.

The performance of the TOPIX and JPX400 indexes in October was up 5.11% and 5.22%, respectively. Over the long term since 2014, the CG Top 20 continues to outperform both indices by about 2% per year. Note that the CG Top20 has been reassessing its component stocks since July 1. The new individual stocks are listed in the table below.

METRICAL: What Initiatives are Companies with High Valuations Taking?

In my previous article, Transitional companies in the prime market: to increase valuations,” I examined companies that increased their market capitalization over the December 2020-February 2022 period and found that the increase was due to higher valuations. I then examined the initiatives of the companies whose Tobin’s q increased during the period in question. I found that changes in Tobin’s q were closely related to increases in foreign ownership, and that firms with large increases in Tobin’s q showed declines in cash equivalents and total assets, suggesting that firms moved to use their assets more effectively. Related to the effective use of assets, these companies have clearly articulated the balance between investment in growth and shareholder returns in their capital allocation policies and have made efforts to communicate with shareholders and investors. With regard to board practices, the companies that significantly increased their Tobin’s q made notable improvements in ensuring the independence of their independent director ratios and compensation committees, as required by prime market listing standards. It was also inferred that the inclusion of companies that eliminated takeover defenses also contributed to boosting Tobin’s q. In light of these results, I’m now interested in what tends to happen to companies with high valuations in the first place, and would like to examine what efforts have been made to address this issue.

The table below shows the correlation analysis between the change in Metrical Tobin’s q and the change in Profile and Key Performance Indicators. Over the period, changes in Tobin’s q are significantly positively correlated with changes in market capitalization and foreign ownership. This confirms that changes in Tobin’s q (valuation) are closely related to changes in market capitalization and foreign ownership. The change in Tobin’s q also shows a significant negative correlation with the change in cash equivalents and the change in total assets. I find that firms that increased Tobin’s q tended to decrease cash equivalents and total assets during the period in question.

METRICAL: Transitional Companies in the Prime Market: To Increase Valuations

・Is the “Plan” for Prime Market Transitional Companies Sufficient?

With the reorganization of the TSE market segmentation has started in April, each listed company has disclosed the market it chooses. Of the 1,841 companies currently listed on the TSE 1st Section that have selected the prime market but cannot meet the prime market listing criteria, 296 companies will be allowed to list on the prime market for the time being through “transitional measures.” The main criteria for prime market listing are a ratio of tradable shares of 35% or more and a total market capitalization of tradable shares of 10 billion yen or more. These companies disclose a “Plan” and apply for the transitional measures. The content of that Plan document is to present medium-term numerical targets and describe measures to achieve those targets. In the case of a company with a shortfall in the current tradable share ratio, the main measure is the elimination of cross-held shares. The problem faced by companies applying transitional measures is often the market capitalization of tradable shares, and there is no special remedy for increasing this. As far as the “Plan” is concerned, most of such companies are trying to draw a story of growth of corporate value and enhancement of shareholder returns, which will lead to an increase in market capitalization. Growth in corporate value and enhanced shareholder returns are very important themes for shareholders and investors. Only when the specifics and probability of these measures are in place can sufficient communication with shareholders and investors be achieved. If these measures are approved by shareholders and investors, they will probably bring about a change in valuations. Valuations can be considered to be built-in to the future cash flows of corporate value growth, so solid growth prospects and cash flow allocations should be required. This is true for all listed companies, not just those to which transitional measures apply. In this issue, I would like to explore some tips on how to improve valuations, one of the most important factors in determining market capitalization.

・Explore factors that can be used to enhance valuations

First, we examine which companies tend to have a higher Tobin’s q
Using the 1,487 comparable companies in the Metrical universe from the end of December 2020 to the end of February 2022, I explore the changes in Tobin’s q and effective factors over the relevant period. The table below shows the correlation analysis between changes in Tobin’s q and changes in the Profile and Key Performance Indicators for the period from the end of December 2020 to the end of February 2022. During this period, changes in Tobin’s q are significantly positively correlated with changes in market capitalization and foreign shareholding ratios. This confirms that changes in Tobin’s q (valuation) are closely related to changes in market capitalization and foreign shareholding ratios. The change in Tobin’s q has also shown a significant negative correlation with the change in cash equivalents and the change in total assets. I find that companies that increased Tobin’s q tended to decrease their cash equivalents and total assets during the period in question.

METRICAL: CG Stock Performance (Japan): September 2022

The stock market closed lower in September due to declines in the U.S. and European stock markets on concerns over rising interest rates. The CG Top20 stock price outperformed both the TOPIX and the JPX400 over the month.

The stock market was firm from the second half of the month as the U.S. market rallied in mid-September on the back of lower long-term interest rates in anticipation of a recession in the U.S. economy. Over the long term since 2014, the CG Top 20 has continued to outperform both indices by about 2% per year. Over the long term since 2014, the CG Top20 continues to outperform both indices by about 2% per annum. The CG Top 20 has been reassessed as of July 1. The new individual stocks are listed in the table below.

METRICAL:CG Stock Performance (Japan): August 2022

August stock prices rose sharply until the first half of the month as the U.S. stock market rallied on expectations of an early end to monetary tightening in the U.S. Toward the end of the month, the market turned highly volatile as the U.S. stock market fell on the concern about longer-than-expected U.S. monetary tightening. The CG Top 20 outperformed both TOPIX and JPX400 during the month.

Until mid-August, the stock market rallied in favor of the U.S. stock market, which rose on expectations of an early end to the U.S. monetary tightening due to the U.S. economic recession speculation. In the latter half of the month, market volatility increased due to concerns about the U.S. FED’s long-term monetary tightening. The TOPIX and JPX400 indexes gained 1.53% and 1.33%, respectively, during the month of August, while the CG Top20 index outperformed both indices, rising 1.66%. The table below shows the components of the CG Top 20 as reviewed on July 1.

METRICAL: What Factors Most Affect Stock Returns?

The common goal of both company management and shareholders is the sustainable growth of the company’s corporate value. Finding such a company is also an important objective for investors. To explore this, I would like to use the 1,487 comparable companies in the Metrical Universe for the period from the end of December 2020 to the end of February 2022 to explore changes in market capitalization and effective factors during this period.

The table below shows the correlation analysis between changes in market capitalization and changes in the Profile and Key Performance Indicators for the period from the end of December 2020 to the end of February 2022. For the period in question, the change in market capitalization shows a significant positive correlation with the change in total assets, the change in foreign ownership, and the change in Tobin’s q. This indicates that companies with higher market capitalization tend to have higher total assets, higher foreign ownership ratios, and higher Tobin’s q. Behind the increase in market capitalization, it makes sense that Tobin’s q, which represents valuations, would increase. It is also natural that there is a correlation between changes in the foreign shareholding ratio and changes in market capitalization in the Tokyo stock market, where foreign investor trading has a strong presence. As for the correlation between changes in total assets and changes in market capitalization, one factor may be the increase in assets supporting earnings growth, but this remains to be examined. On the other hand, change in market capitalization did not show a significant positive correlation with change in cash equivalents, change in ROE, or change in ROA. It can be seen that in the period in question, the change in profitability on an actual basis over the past 3 years did not have much impact on the change in market capitalization.

METRICAL: CG Stock Performance (Japan): July 2022

In July, the stock market was supported by the strong U.S. stock market and began to test a return from the second half of the month. The CG Top20, whose components were changed once a year starting this month, continues to outperform over the long term while slightly underperforming against both the TOPIX and JPX400 over the one-month period.

The stock market was firm from the second half of the month as the U.S. market rallied in mid-July on the back of lower long-term interest rates in anticipation of a recession in the U.S. economy. Over the long term since 2014, the CG Top 20 has continued to outperform both indices by about 2% per year. Over the long term since 2014, the CG Top20 continues to outperform both indices by about 2% per annum. The CG Top 20 has been reassessed as of July 1. The new individual stocks are listed in the table below.ly 2022

METRICAL: Considerations Regarding Retirement of Treasury Stock

I am sure you are aware that the number of companies moving to retire treasury stock is gradually increasing due to prime market listing standards. In my previous article, Metrical’s analysis has also revealed that companies that have retired treasury stock three or more times are also more positive in their corporate governance efforts. If share repurchases are a sign that corporate governance initiatives and performance improvement are working in tandem, it is very welcome. I would like to think more about how the actual action taken by the company to retire its own shares relates to corporate governance.

The table below shows the correlation between the frequency of share buybacks and ROE, ROA, and Tobin’s q for the Metrical Universe (as of 1/2022). As shown in the previous article, a highly significant positive correlation between the frequency of share buybacks and ROE and ROA has been confirmed, indicating that the more frequently a company retires its own shares, the higher its ROE and ROA.

This result seems reasonable, because to cancel treasury stock, a company has to buy back its own shares, which has a positive effect on ROE and ROA. On the other hand, the correlation between Tobin’s q and the frequency of share repurchases is not shown to be significant. This means that a company that retires its own shares more frequently does not have a higher stock price valuation, which means that a company that retires its own shares does not have a significant relationship with its stock price valuation. Although the company buys back its own shares before retiring them, this result is also reasonable because the company does not take Tobin’s q (P/B) into account when making its decision to buy back its own shares. On the other hand, it is interesting to note that there is a highly significant positive correlation between the rate of change in market capitalization (12/2021-1/2022) and the frequency of stock repurchases. Even though the frequency of share buybacks is not correlated with respect to stock price premium or discount, it is related to the rate of change in market capitalization over the period 12/2021-1/2022. Over this 13-month period, the more frequent the company’s share retirement (or stock repurchase), the greater the increase in market capitalization. The results show that stock retirement was associated with an increase in market capitalization over this period.

METRICAL: CG Stock Performance (Japan): June 2022

June stock market also ended the month with direction-less trading, after large swings up and down led by the U.S. stock market. The CG Top 20 stock index largely outperformed while both the TOPIX and JPX400 indexes declined.

After falling in mid-June on the back of the U.S. stock prices decline due to a rise in the U.S. CPI, Japan’s market was expected to continue its rebound phase in the second half of the month due to a sense of buying on declining.
While both TOPIX and JPX400 weakened -2.08% and -2.42% in June respectively, the CG Top 20 rose +1.03% and outperformed both indices significantly.