・Is the “Plan” for Prime Market Transitional Companies Sufficient?
With the reorganization of the TSE market segmentation has started in April, each listed company has disclosed the market it chooses. Of the 1,841 companies currently listed on the TSE 1st Section that have selected the prime market but cannot meet the prime market listing criteria, 296 companies will be allowed to list on the prime market for the time being through “transitional measures.” The main criteria for prime market listing are a ratio of tradable shares of 35% or more and a total market capitalization of tradable shares of 10 billion yen or more. These companies disclose a “Plan” and apply for the transitional measures. The content of that Plan document is to present medium-term numerical targets and describe measures to achieve those targets. In the case of a company with a shortfall in the current tradable share ratio, the main measure is the elimination of cross-held shares. The problem faced by companies applying transitional measures is often the market capitalization of tradable shares, and there is no special remedy for increasing this. As far as the “Plan” is concerned, most of such companies are trying to draw a story of growth of corporate value and enhancement of shareholder returns, which will lead to an increase in market capitalization. Growth in corporate value and enhanced shareholder returns are very important themes for shareholders and investors. Only when the specifics and probability of these measures are in place can sufficient communication with shareholders and investors be achieved. If these measures are approved by shareholders and investors, they will probably bring about a change in valuations. Valuations can be considered to be built-in to the future cash flows of corporate value growth, so solid growth prospects and cash flow allocations should be required. This is true for all listed companies, not just those to which transitional measures apply. In this issue, I would like to explore some tips on how to improve valuations, one of the most important factors in determining market capitalization.
・Explore factors that can be used to enhance valuations
First, we examine which companies tend to have a higher Tobin’s q
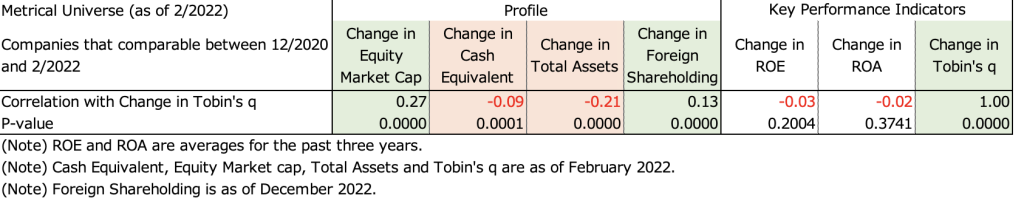
Using the 1,487 comparable companies in the Metrical universe from the end of December 2020 to the end of February 2022, I explore the changes in Tobin’s q and effective factors over the relevant period. The table below shows the correlation analysis between changes in Tobin’s q and changes in the Profile and Key Performance Indicators for the period from the end of December 2020 to the end of February 2022. During this period, changes in Tobin’s q are significantly positively correlated with changes in market capitalization and foreign shareholding ratios. This confirms that changes in Tobin’s q (valuation) are closely related to changes in market capitalization and foreign shareholding ratios. The change in Tobin’s q has also shown a significant negative correlation with the change in cash equivalents and the change in total assets. I find that companies that increased Tobin’s q tended to decrease their cash equivalents and total assets during the period in question.
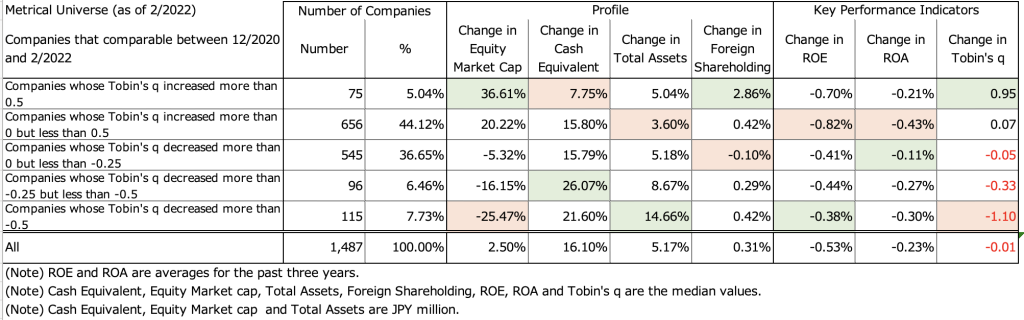
The table below shows the layers divided into the following 5 groups three in the Metrical Universe in terms of change in Tobin’s q: (a) companies that increased Tobin’s q by more than 0.5, (b) companies that increased Tobin’s q by more than 0 but less than 0.5, (c) companies that increased Tobin’s q by more than 0 but less than 0.5, (d) companies that decreased Tobin’s q by more than 0.5 but less than 0.5, (e) companies that decreased Tobin’s q by more than 0.5 but less than 0.5. The highest values for (a) companies that increased Tobin’s q by more than 0.5 were changes in market capitalization and foreign shareholding ratios, while the lowest values were changes in cash equivalents, thus supporting the above correlation analysis. The average ROE and ROA over the past 3 years declined for all groups during the period, indicating mixed movements between groups in the degree of change in ROE and ROA and the change in Tobin’s q.
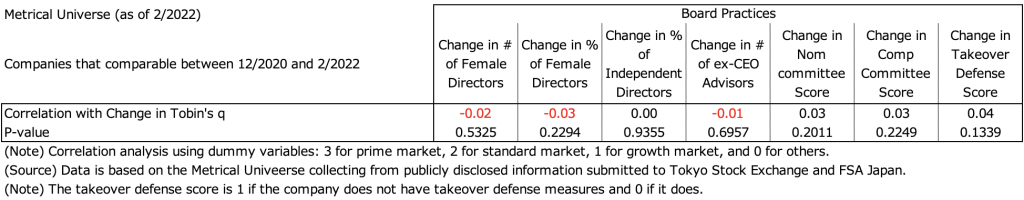
Let us now look at how the companies that have increased their Tobin’s q have addressed corporate governance practices during the period in question. The table below shows the correlation analysis between the change in Tobin’s q and the change in each of the board practice measures during the relevant period. None of the changes in Tobin’s q showed a significant positive correlation with any of the changes in the board practices evaluation items. The results show no direct causal relationship between changes in board practice assessment items and changes in Tobin’s q over a period of a little more than one year.
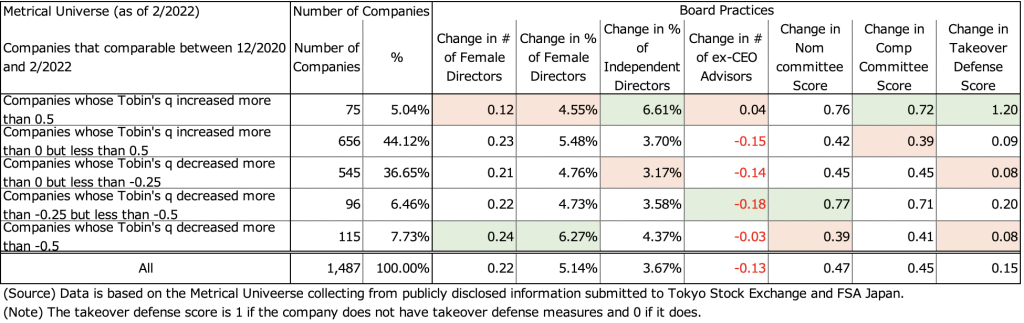
The table below shows a layered analysis of the Metrical universe into 5 groups in terms of change in Tobin’s q for each of the board practice measures. The items for which (a) companies that increased their Tobin’s q by more than 0.5 had the best values were the change in the independent director ratio, the change in the compensation committee score, and the change in the anti-takeover measure score. The most notable outperformance was in the change in the ratio of independent directors and the change in the takeover defense score. The change in nominating committee score was also a close second. Both the ratio of at least one-third independent directors and the establishment and independence of nominating and compensation committees were items included in the prime market listing criteria. The elimination of takeover defense measures has been found to be highly correlated with changes in market capitalization and foreign shareholder ratios (see my previous article “Takeover Defense Measures and Foreign Shareholder Ratio”), so it is inferred that the increase in foreign shareholder ratios has increased valuations. Increasing the ratio of independent directors and ensuring the transparency of the board of directors by ensuring the independence of the nominating and compensation committee are faber initiatives for foreign shareholders and foreign investors. On the other hand, the most negative results for companies(a) that increased Tobin’s q by more than 0.5 were changes in the number of female directors, changes in the percentage of female directors, and changes in the number of ex-CEO advisors. It can be argued that the (a) companies that increased Tobin’s q by more than 0.5 were less concerned with these practices.
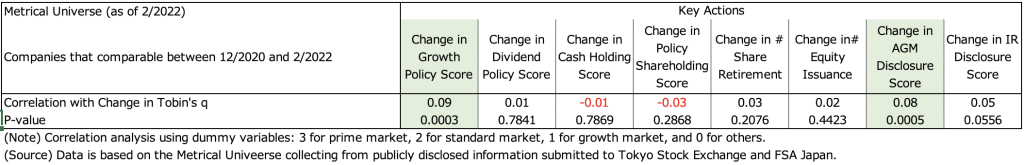
Next, let’s look at changes in Tobin’s q and the key actions actually taken by the company. The table below shows the correlation analysis between the change in Tobin’s q and the change in each of the key actions. A significant positive correlation is shown with the score. The results show that a clearer growth policy tends to contribute to the expansion of Tobin’s q. It can be inferred that changes in AGM disclosure scores are highly correlated with changes in foreign shareholding ratios, which in turn has affected changes in Tobin’s q.
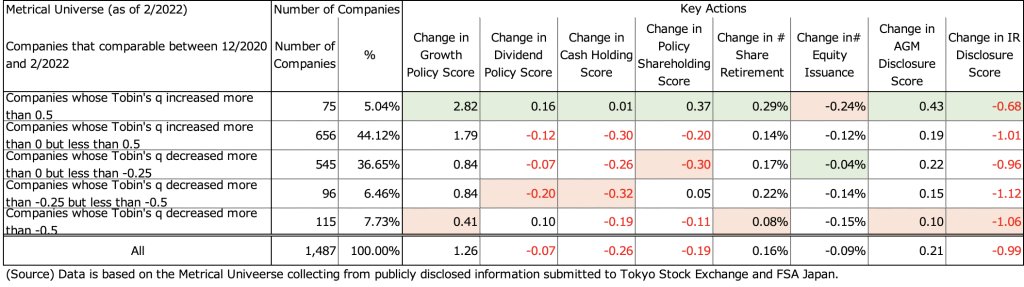
The table below shows a layered analysis of the Metrical universe into five groups in terms of changes in Tobin’s q for each of the key actions. (a) Companies that increased their Tobin’s q by more than 0.5 had the best values for the following items: change in growth policy score, change in dividend policy score, change in cash holdings score, change in frequency of share retirements, change in AGM disclosure score, and change in IR disclosure score. The item for which (a) companies that increased their Tobin’s q by more than 0.5 showed the poorest value was the change in equity financing frequency. After all, as mentioned at the beginning of this report, what is required of listed companies as part of their dialogue with shareholders and investors is to clarify the balance between investment in growth and shareholder returns in their capital allocation policies and to engage in communication with shareholders and investors in their disclosures as well. This is not limited to the period in question, and perhaps companies that are able to steadily implement these initiatives in the future can be expected to gain the support of overseas investors and increase their valuations. The reason why this group was less successful in changing the frequency of equity financings may be due to the fact that this group needed the capital to invest in growth. However, these companies were able to increase their valuations because they were able to communicate well with shareholders and investors on their capital allocation policies based on growth investments.
In summary, in this report, I focus on the changes in Tobin’s q for the 1,487 companies in the Metrical universe that can be compared from the end of December 2020 to the end of February 2022, and what kind of initiatives were taken by the companies whose Tobin’s q increased. I decided to examine what factors are effective in driving up valuations. During this period, it was confirmed that the change in Tobin’s q was still closely related to the increase in foreign shareholding ratio. In addition, companies with large increases in Tobin’s q showed a downward trend in cash equivalents and total assets, suggesting that the companies moved to use their assets more effectively. While no significant correlation was shown between Tobin’s q in board practices, the companies with a large increase in Tobin’s q showed a significant increase in the ratio of independent directors required by prime market listing standards and in the establishment and independence of compensation committees, suggesting that companies have made more effective use of their assets. It is also assumed that the elimination of takeover defenses also helped boost Tobin’s q. With respect to key actions, they showed a significant positive correlation with the change in the growth policy score and the AGM disclosure score. It is also assumed that the elimination of takeover defenses also helped boost Tobin’s q. With respect to Key Actions, they showed a significant positive correlation with the change in the growth policy score and the AGM disclosure score. In addition, companies with a significant increase in Tobin’s q had superior values for change in growth policy score, change in dividend policy score, change in cash holdings score, change in frequency of share repurchases, change in AGM disclosure score, and change in IR disclosure score. It can be inferred that these companies were able to articulate the balance between investment in growth and shareholder returns in their capital allocation policies, and work on communication with shareholders and investors in their disclosures as well. These may be helpful for companies that have chosen the prime market and are subject to transitional measures. It is expected that these companies will clarify their medium-term growth investment and shareholder return policies as capital allocation policies in their “Plan” and promote communication with shareholders and investors in their disclosures.
Aki Matsumoto, CFA
Please see detail research the following links.
http://www.metrical.co.jp/
Please feel free to contact the below email address if any interest or query.
Aki Matsumoto, CFA
Executive Director
Metrical Inc.
akimatsumoto@metrical.co.jp
http://www.metrical.co.jp/jp-home/