In my previous article, “Transitional companies in the prime market: to increase valuations,” I examined companies that increased their market capitalization over the December 2020-February 2022 period and found that the increase was due to higher valuations. I then examined the initiatives of the companies whose Tobin’s q increased during the period in question. I found that changes in Tobin’s q were closely related to increases in foreign ownership, and that firms with large increases in Tobin’s q showed declines in cash equivalents and total assets, suggesting that firms moved to use their assets more effectively. Related to the effective use of assets, these companies have clearly articulated the balance between investment in growth and shareholder returns in their capital allocation policies and have made efforts to communicate with shareholders and investors. With regard to board practices, the companies that significantly increased their Tobin’s q made notable improvements in ensuring the independence of their independent director ratios and compensation committees, as required by prime market listing standards. It was also inferred that the inclusion of companies that eliminated takeover defenses also contributed to boosting Tobin’s q. In light of these results, I’m now interested in what tends to happen to companies with high valuations in the first place, and would like to examine what efforts have been made to address this issue.
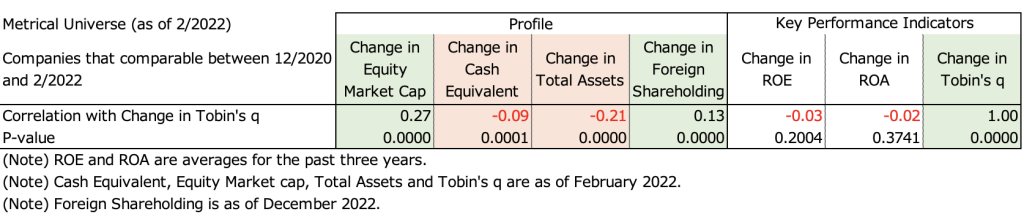
The table below shows the correlation analysis between the change in Metrical Tobin’s q and the change in Profile and Key Performance Indicators. Over the period, changes in Tobin’s q are significantly positively correlated with changes in market capitalization and foreign ownership. This confirms that changes in Tobin’s q (valuation) are closely related to changes in market capitalization and foreign ownership. The change in Tobin’s q also shows a significant negative correlation with the change in cash equivalents and the change in total assets. I find that firms that increased Tobin’s q tended to decrease cash equivalents and total assets during the period in question.
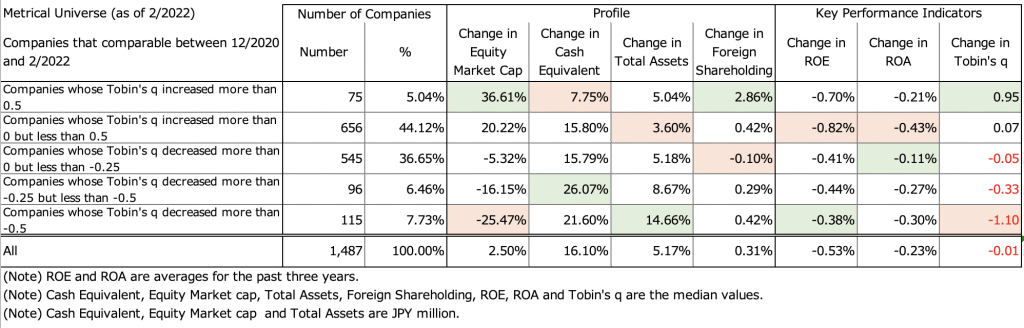
The table below shows the Metrical universe as a function of change in Tobin’s q for (a) companies that increased Tobin’s q by more than 0.5, (b) companies that increased Tobin’s q by more than 0 but less than 0.5, (c) companies that decreased Tobin’s ‘s q decreased by more than 0 and less than 0.25, (d) companies that decreased Tobin’s q by more than 0.25 and less than 0.5, and (e) companies that decreased Tobin’s q by more than 0.5. Since the highest values for (a) companies that increased Tobin’s q by more than 0.5 were changes in market capitalization and changes in foreign ownership, and the lowest values were changes in cash equivalents, the results support the correlation analysis above. The average ROE and ROA over the past 3 years declined for all groups during the period, indicating mixed movements between groups in the degree of change in ROE and ROA and in the change in Tobin’s q.
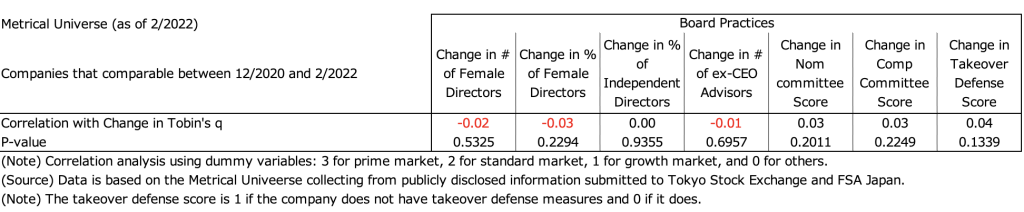
Let us now look at how the companies that increased Tobin’s q addressed corporate governance practices during the period in question. The table below shows the correlation analysis between the change in Tobin’s q and the change in each of the board practice assessment items during the relevant period. No change in Tobin’s q showed a significant positive correlation with any of the changes in board practice assessment items. This indicates that there is no direct causal relationship between changes in board practice assessment items and changes in Tobin’s q over a period of a little more than one year.
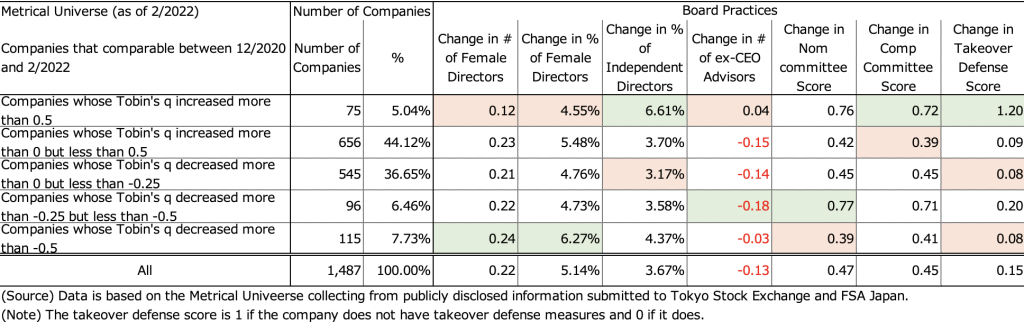
The table below shows a layered analysis of the Metrical universe into 5 groups in terms of change in Tobin’s q for each of the Board Practice criteria. (a) The items for which companies that increased their Tobin’s q by more than 0.5 had the best values were the change in the independent director ratio, the change in the compensation committee score, and the change in the anti-takeover measure score. The most notable outperformers were the change in the ratio of independent directors and the change in the takeover defense score. The change in the Nominating Committee score was a close second. Both the ratio of at least one-third independent directors and the establishment and independence of nominating and compensation committees were items included in the prime market listing criteria. The elimination of takeover defense measures is highly correlated with changes in market capitalization and foreign shareholder ratios (see my previous article “Takeover Defense Measures and Foreign Shareholder Ratio”), which suggests that the increase in foreign shareholder ratios has increased valuations. This suggests that the increase in the foreign shareholder ratio has increased valuations. Ensuring transparency of the board of directors by increasing the ratio of independent directors and ensuring the independence of the nominating and compensation committee is a favored initiative for foreign shareholders and foreign investors. On the other hand, the most negative results for firms that increased Tobin’s q by more than 0.5 in (a) were changes in the number of female directors, changes in the ratio of female directors, and changes in the number of ex-CEO advisors. It can be argued that the firms that increased Tobin’s q by more than 0.5 in (a) were less concerned with these practices.
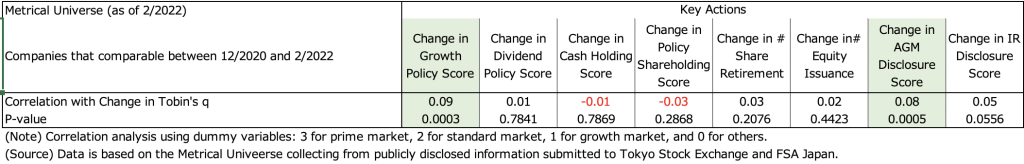
Next, let’s look at changes in Tobin’s q and the actual key actions taken by the company. The table below shows the correlation analysis between the change in Tobin’s q and the change in each of the Key Actions. The results show a significant positive correlation with the growth policy score and the AGM disclosure score among the key action measures. The results indicate that a clearer growth policy tends to contribute to an increase in Tobin’s q. It can be inferred that changes in the AGM disclosure score are highly correlated with changes in the foreign ownership ratio, which in turn has an effect on changes in Tobin’s q.
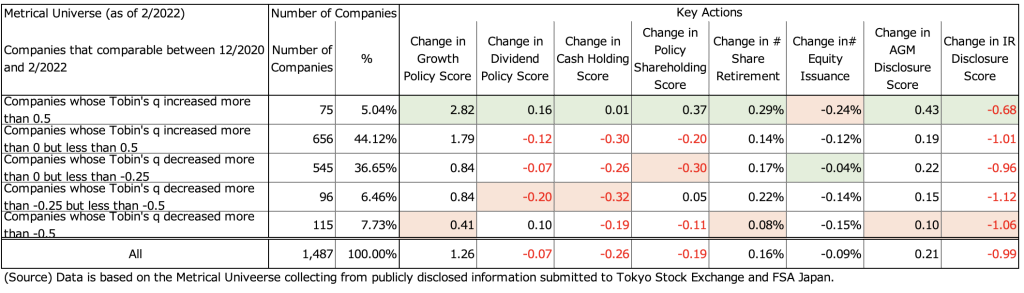
The table below shows a layered analysis of the Metrical universe into 5 groups in terms of change in Tobin’s q for each of the key action measures. (a) Companies that increased their Tobin’s q by more than 0.5 had the best values for the following items: change in growth policy score, change in dividend policy score, change in cash holdings score, change in frequency of share retirements, change in AGM disclosure score, and change in IR disclosure score. (a) The item for which companies that increased their Tobin’s q by more than 0.5 showed the poorest value was change in equity financing frequency. As mentioned at the beginning of this article, what is required of listed companies as part of their dialogue with shareholders and investors is to clarify the balance between investment in growth and shareholder returns in their capital allocation policy and to engage in communication with shareholders and investors in their disclosure. As mentioned at the beginning of this paper, what is required of listed companies as part of their dialogue with shareholders and investors is to clarify the balance between investment in growth and shareholder returns in their capital allocation policy and to engage in communication with shareholders and investors in their disclosure.
Companies that increased their Tobin’s q by more than 0.5 in (a) during the relevant period indicate that they have made progress in addressing these issues. This is not limited to the period in question, and it is expected that companies that are able to steadily implement these initiatives will probably continue to gain the support of overseas investors and increase their valuations in the future. The reason why this group was less successful in changing the frequency of equity financings may be due to the fact that this group needed capital for growth investments. However, these companies were able to increase their valuations because they were able to communicate well with shareholders and investors on their capital allocation policies based on growth investments.
In summary, this time I focused on changes in Tobin’s for 1,487 companies in the comparable Metrical universe from the end of December 2020 to the end of February 2022, and examined what efforts were made by the companies whose Tobin’s q had increased. I also looked at the companies whose Tobin’s q had increased to see which factors were most effective in driving up valuations. I found that changes in Tobin’s q were still closely related to increases in foreign ownership during the period in question. In addition, companies with large increases in Tobin’s q showed a downward trend in cash equivalents and total assets, suggesting that the companies moved to use their assets more effectively. While no significant correlation was shown between Tobin’s q in board practices, companies with large increases in Tobin’s q made notable improvements in the ratio of independent directors and in the establishment and independence of compensation committees, both of which are required by prime market listing standards. It can also be inferred that the elimination of takeover defenses also helped boost Tobin’s q. With respect to Key Actions, they showed a significant positive correlation with the change in the Growth Policy score and the AGM Disclosure score. In addition, companies with a significant increase in Tobin’s q showed superior values for change in growth policy score, change in dividend policy score, change in cash holding score, change in frequency of share repurchases, change in AGM disclosure score, and change in IR disclosure score. These companies showed superior values for change in dividend policy score, change in cash holding score, change in frequency of share buybacks, change in AGM disclosure score, and change in IR disclosure score. It can be assumed that these companies were able to articulate the balance between investment in growth and shareholder returns in their capital allocation policies and address communication with shareholders and investors in their disclosure.
Aki Matsumoto, CFA
Please see detail research the following links.
http://www.metrical.co.jp/
Please feel free to contact the below email address if any interest or query.
Aki Matsumoto, CFA
Executive Director
Metrical Inc.
akimatsumoto@metrical.co.jp
http://www.metrical.co.jp/jp-home/