In July, the stock market was highly volatile, rising sharply at the beginning of the month, then falling sharply toward the end of the month, before recovering at the end of the month. In July, the CG Top 20 significantly outperformed the TOPIX and JPX400 for the third consecutive month. The July stock market, which […]
Author: Aki Matsumoto
Executive Director, Head of CG Research at METRICAL INC., involving in the investment management since 1984. Chartered Financial Analyst.
METRICAL: Improved Profitability to Attract Overseas Investors Key to Raise Valuation Even After TSE’s Request
One year has passed since the TSE requested a P/B increase at the end of March 2023 (“Request for action to achieve cost of capital and stock price conscious management”). Valuations are expected to increase as stock prices rise. In this analysis, I examined what trends were observed in the companies that increased their Tobin’s Q in the Metrical universe during the period from March 2023 to March 2024.
In the comparable Metrical universe of 1,750 companies from March 2023 to March 2024, the analysis is divided into 5 groups (>50% increase, >25% to <50% increase, >0% to <25% increase, no change, and decrease) for each item in terms of the percentage change in Tobin's Q. The median percent change in Tobin's Q during this period was 2.06%. The table below profiles the 1,750 companies in the Metrical universe, dividing them into five groups (>50% increase, >25% to <50% increase, >0% to <25% increase, no change, and decrease) by the percentage change in Tobin's Q over the one-year period from March 2023 to March 2024. We can see that companies whose Tobin's Q increased by more than 50% include those with high Tobin's Q, average ROE and ROA over the past three years, and foreign shareholding ratios. Although companies whose Tobin's Q rose by more than 50% in terms of market capitalization gave up the top spot to companies whose Tobin's Q rose by more than 25% but less than 50%, the relatively large market capitalization of these companies caused their Tobin's Q to rise. The companies whose Tobin's Q increased by more than 50% and by more than 25% but less than 50% continued to increase their ROE and ROA.
METRICAL: CG Top20 Stock Performance of Japan vs. TOPIX (June2024)
In June, the stock market was pushed down in the middle of the month amid the lack of active buyers, but recovered and closed higher at the end of the month.
However, the stock market fell sharply in the middle of the month due to speculation that a certain financial institution, which had suffered heavy losses from its investment in foreign bonds, had conducted an operation to sell passive equity funds to take profits. The stock market then calmed down toward the end of the month and closed slightly higher than at the end of the previous month.
The TOPIX and JPX400 indexes gained 1.40% and 1.63%, respectively, in May, while the CG Top 20 index outperformed significantly both indices up by 2.04%.
METRICAL:Drivers of Corporate Governance Improvement Are the Percentage of Foreign Shareholdings
In January 2024, Japanese stocks rose sharply as overseas investors bought Japanese stocks for the first time since June 2023. There has been no change in the composition of Japanese equities driven by overseas investors, who account for over 70% of the TSE’s trading volume. Meanwhile, since the TSE’s request at the end of March 2023, listed companies have been struggling to raise their stock price valuations (P/B). We have also seen an increase in disclosures from listed companies that seem to be expecting overseas investors to buy their shares. In this article, we will focus on the ratio of foreign shareholdings and analyze the trends in companies in which overseas investors invest. The contents of this article should be of interest not only to overseas investors, but also to listed companies.
The Metrical universe of 1,822 companies (as of January 2024) is divided into five groups (30% or more, 20% or more but less than 30%, 15% or more but less than 20%, 10% or more but less than 15%, and less than 10%) based on foreign shareholding ratio and analyzed for each category. The median foreign shareholding ratio is 15%; companies with 15% or more can be said to have higher foreign shareholding ratios. Also, as discussed in my previous article “Takeover Defense Measures and Foreign Shareholder Ratio,” there is a sort of threshold at 30%. When the foreign shareholding ratio exceeds 30%, it becomes more difficult for the company to secure 1/3 of the special resolution at the shareholders’ meeting, and thus the influence of foreign shareholders becomes stronger, which in turn can be expected to improve the company’s management.
Higher ROE & ROA Are Keys to Higher Valuation, but This Wasn’t Easy for Companies with Low Valuation
I would like to examine which companies have experienced an increase in stock valuations over the past year, and have analyzed the characteristics of the 1,755 companies in the comparable Metrical universe whose Tobin’s Q increased between the end of December 2022 and the end of December 2023. The table below shows the median value of the change in Tobin’s Q for each of the six groups.

CG Stock Performance (Japan): April 2024
April’s stock market returned to values toward the end of the month, although the swing was large throughout the month.
The CG Top 20 stock market outperformed both the TOPIX and JPX400 in April by a wide margin.
Weakness in the U.S. stock market due to concerns about the risk of prolonged inflation and selling of semiconductor sector stocks caused Japanese stock prices to fall from mid-month, but the yen continued to weaken due to the Bank of Japan’s ongoing monetary easing, leading to a buying bounce toward the end of the month.
The TOPIX and JPX400 indexes gained -0.77% and -0.30%, respectively, in April, while the CG Top 20 index underperformed both indices by 1.30%.
The composites of CG Top 20 stocks has been replaced as of July 1.
Wacom (6727), K’s Holdings (8282), Eisai (4523), NSD (9757), and Trend Micro (4704) were new additions, while Ebara Corporation (6361), Orix (8591), United Arrows (7606), Tokyo Gas (9531) and Hoosiers Holdings (3284) were removed. Details of the component stocks are shown in the table below.
METRICAL – CG Stock Performance (Japan): February 2024
The February stock market continued to be strong from the beginning of the month.
In February, the CG Top 20 underperformed both the TOPIX and JPX400 stock indices.
Supported by high overseas stock market prices in the U.S. and other countries, the Japanese stock market was also solid throughout the month, with the Nikkei 225 hitting its all-time high in 1989 on February 22. The stocks continued to be firm toward the end of the month.
The TOPIX and JPX400 indexes gained 4.83% and 4.75%, respectively, in February, while the CG Top20 stocks underperformed against both indexes, dipping -0.97%.
The composites of CG Top 20 stocks has been replaced as of July 1.
Wacom (6727), K’s Holdings (8282), Eisai (4523), NSD (9757), and Trend Micro (4704) were new additions, while Ebara Corporation (6361), Orix (8591), United Arrows (7606), Tokyo Gas (9531) and Hoosiers Holdings (3284) were removed. Details of the component stocks are shown in the table below.
【METRICAL】Corporate Governance in Japan Is Improving, but Has yet to Take Steps to Create Value
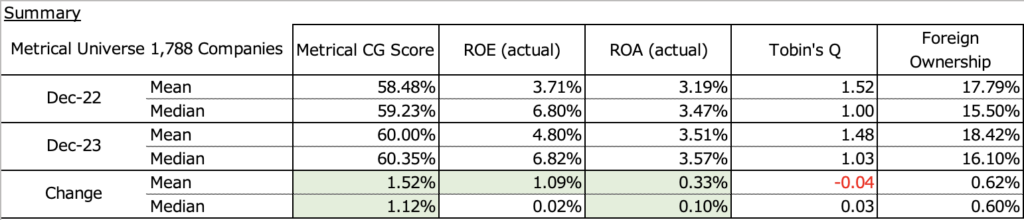
Metrical provides monthly corporate governance assessments of approximately 1,800 companies, primarily prime market listed companies. This year, continuing on from last year, we would like to see how much progress has been made in corporate governance initiatives by listed companies over the past year.
We analyzed how much the 1,788 companies in the comparable Metrical universe improved in each evaluation category between December 31, 2022 and December 31, 2023. The table below shows the Metrical CG score, which is the overall corporate governance score, the average ROE and ROE over the past three years, the change in Tobin’s Q and foreign shareholding ratio in December 2022, December 2023, and change from 2022 to 2023, and the mean and median values.
【METRICAL】Companies Are Finally at the Starting Line of Taking the First Steps to Improve ROE
On October 26, 2023, the TSE released the “Publication of the List of Disclosed Companies Regarding “Measures to Achieve Management Conscious of Cost of Capital and Stock Prices.” I would like to provide an overview of this document below and consider the issues it discusses.
1. Future initiatives regarding “measures to realize management conscious of cost of capital and stock price”
Publication of the list of disclosing companies, and re-communication of the purpose and points to be noted.
Publication of a list of companies disclosing information in accordance with the request, with a view to informing investors of the status of companies that are taking steps to comply and to encourage their efforts. The list will be published on January 15, 2024, and will be updated monthly.
【Metrical】Percentage of Female Board Members Is a Measure of a Company’s Seriousness About Improving Its Practices
Following the previous analysis of the ratio of independent directors, here is an analysis of the ratio of female board members. As you know, the Japanese government has set a target of increasing the ratio of female board members ( board directors, statutory executive officers, and statutory auditors) to 30% by 2030 for companies listed on the prime market. Using data from the Metrical Universe at the end of September, I will examine the characteristics of each group in terms of the ratio of female board members.
Of the 1,781 companies in the Metrical Universe at the end of September, 74 (4.2%) have achieved a ratio of 30% or more female directors. The government and TSE have also set an intermediate goal of appointing at least one female board member by 2025. 1,567 (88%) of the 1,781 companies in the Metrical Universe at the end of September have at least one female board member. The 1,781 companies in the Metrical universe also include companies listed outside the prime market. It also includes companies like Canon that are expected to appoint female board members at future AGMs, so it is likely that the majority of prime market listed companies will have appointed female board members by 2025.