The common goal of both company management and shareholders is the sustainable growth of the company’s corporate value. Finding such a company is also an important objective for investors. To explore this, I would like to use the 1,487 comparable companies in the Metrical Universe for the period from the end of December 2020 to the end of February 2022 to explore changes in market capitalization and effective factors during this period.
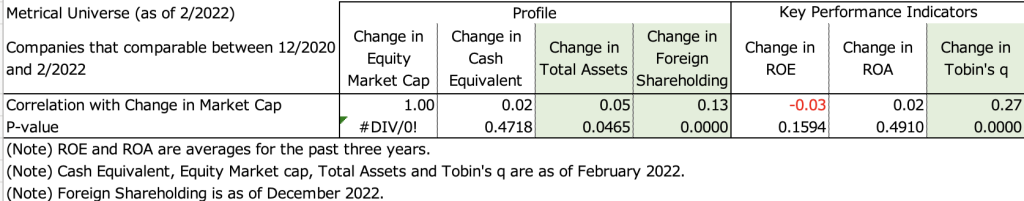
The table below shows the correlation analysis between changes in market capitalization and changes in the Profile and Key Performance Indicators for the period from the end of December 2020 to the end of February 2022. For the period in question, the change in market capitalization shows a significant positive correlation with the change in total assets, the change in foreign ownership, and the change in Tobin’s q. This indicates that companies with higher market capitalization tend to have higher total assets, higher foreign ownership ratios, and higher Tobin’s q. Behind the increase in market capitalization, it makes sense that Tobin’s q, which represents valuations, would increase. It is also natural that there is a correlation between changes in the foreign shareholding ratio and changes in market capitalization in the Tokyo stock market, where foreign investor trading has a strong presence. As for the correlation between changes in total assets and changes in market capitalization, one factor may be the increase in assets supporting earnings growth, but this remains to be examined. On the other hand, change in market capitalization did not show a significant positive correlation with change in cash equivalents, change in ROE, or change in ROA. It can be seen that in the period in question, the change in profitability on an actual basis over the past 3 years did not have much impact on the change in market capitalization.
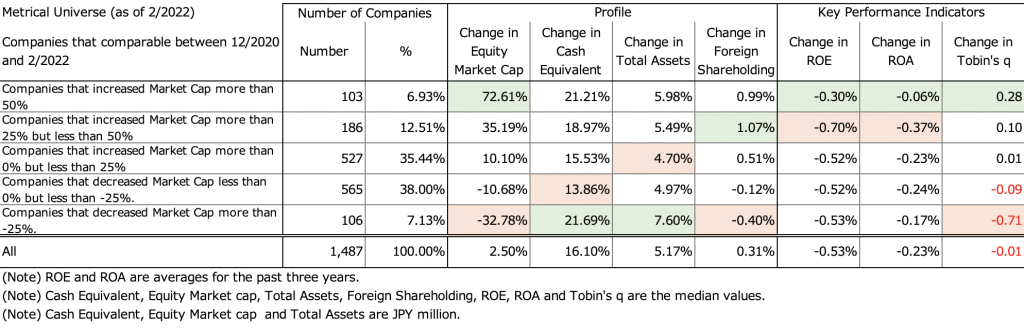
The table below shows a layered analysis of the Metrical universe in terms of changes in market capitalization, dividing it into 5 groups: (a) companies whose market capitalization increased by more than 50%, (b) companies whose market capitalization increased by more than 25% but less than 50%, (c) companies whose market capitalization increased by more than 0% but less than 25%, (d) companies whose market capitalization decreased by more than 0% but less than 25%, and (e) companies whose market capitalization decreased by more than 25%. The items for which (a) companies whose market capitalization increased by more than 50% showed the best values were change in ROE, change in ROA, and change in Tobin’s q. However, of these 3 items, the only item for which (e) companies whose market capitalization declined by more than 25% showed the poorest value was the change in Tobin’s q. The group that showed the most inferior values for changes in ROE and ROA was (b) companies whose market capitalization increased by more than 25% but less than 50%, indicating that changes in ROE and ROA do not necessarily affect changes in market capitalization. On the other hand, the change in foreign shareholding ratio shows the above correlation, since (a) companies whose market capitalization increased by more than 50% had the second best value and (e) companies whose market capitalization decreased by more than 25% had the poorest value. Since the profitability outlook is not shown here, it is assumed that it was the change in valuations and the change in profitability outlook (rather than the change in actual-based profitability) that impacted the change in market capitalization during the period. In terms of changes in cash equivalents and total assets, (e) companies with market capitalization declining by more than 25% show the largest increases. Since these firms do not seem to have improved their profitability noticeably as far as changes in ROE and ROA are concerned, it is likely that these firms include companies that were significantly affected by the COVID-19 pandemic and increased their cash equivalents as a result of capital increases to increase their equity capital.
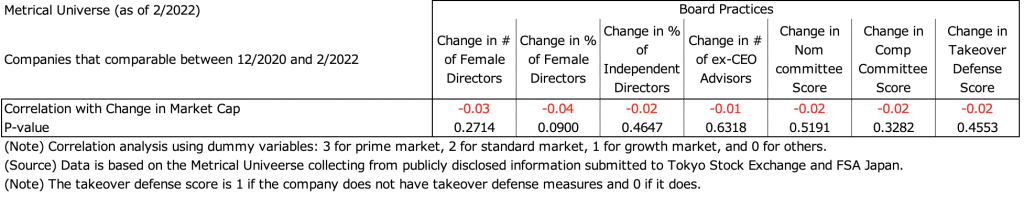
Let’s take a look at how changes in market capitalization and corporate governance have changed. The table below shows the correlation analysis between the change in market capitalization and the change in each of the board practices. It is difficult to expect board practices to directly affect market capitalization over a period of a little more than a year. I believe that it takes a certain period of time before the benefits of improved board practices are realized. In addition, I expect that improvements in board practices will lead to improvements in the decision-making process regarding important management issues, which will in turn influence actual corporate behavior and, consequently, contribute to an increase in market capitalization.
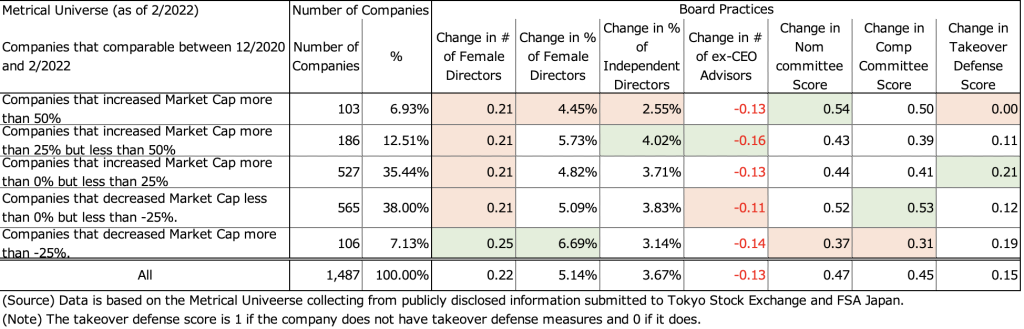
The table below shows a layered analysis of the 5 groups of changes in market capitalization for each of the board practices evaluated. The results of the layered analysis also support the correlation analysis above. (a) Companies whose market capitalization increased by more than 50% had the best value and (e) companies whose market capitalization decreased by more than 25% had the poorest value, with the change in nominating committee score being the only evaluation item with the poorest value. The remaining evaluation items show mixed movements in the group of changes in market capitalization and in the changes in each evaluation item. As noted above, I again feel that it is difficult for board practice evaluation items to directly affect changes in market capitalization in a short period of time of about one year.
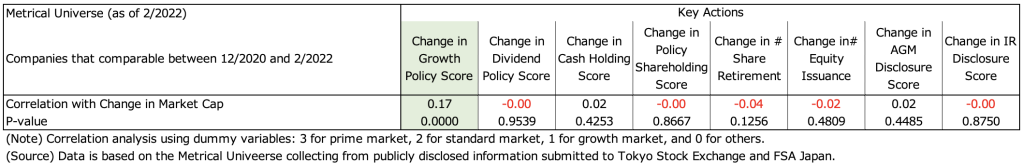
Next, let us look at changes in market capitalization and the key actions actually taken by the company. The table below shows the correlation analysis between the change in market capitalization and the change in each of the key actions. The change in market capitalization has a significant positive correlation with the change in the growth policy score among the key actions. Assuming that a clearer growth policy has contributed to the increase in market capitalization, I can expect that good actions are moving in a positive direction that positively affects market capitalization.
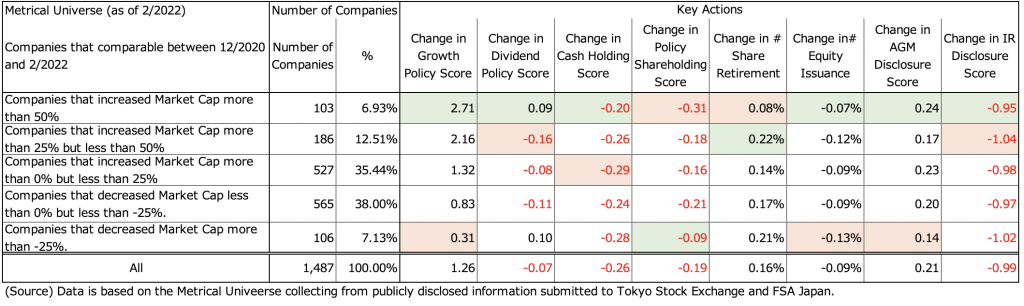
The table below shows a layered analysis of the 5 groups of key actions in terms of changes in each of the key assessment items in the key actions. The key actions that had the best value for (a) companies whose market capitalization increased more than 50% and (e) companies whose market capitalization decreased more than 25% had the poorest value, were changes in growth policy score, change in frequency of equity issuance, and change in AGM disclosure score. On the other hand, changes in dividend policy score, cash holdings score (cash/sales), policy holdings score (policy holdings/total assets), frequency of share retirement, and IR disclosure score showed mixed relationships with the company groups in terms of changes in market capitalization. The hypotheses here are that, rather than implementing each of the shareholder return measures independently, It is important to clearly state the growth policy in a systematic manner that companies should consider what policies they should adopt for growth investment and shareholder return (dividends, share buybacks/retirement) as part of their growth strategy and how they should effectively use cash and assets as part of their capital allocation (including the intention of policy shareholding). Rather than launching each measure of shareholder return as a single shot and hoping that it will have the effect of increasing the share price, it would be more persuasive to make the management’s intentions known to investors.
In summary, using the Metrical universe of 1,487 companies, which is comparable from the end of December 2020 to the end of February 2022, I tried to explore what factors were effective in terms of changes in market capitalization. During the period, the increase in foreign ownership and the increase in Tobin’s q contributed to the increase in market capitalization. Since ROE and ROA have declined in the past 3 years average on an actual basis, it can be inferred that changes in the outlook for improving profitability increased valuations and foreign ownership ratios more than on an actual basis, leading to an increase in market capitalization for companies with higher valuations. On the other hand, the results indicate that it is difficult to expect board practices to directly affect market capitalization over a period of about 1 year. Therefore, I would like to maintain the hypothesis that improvements in board practices contribute to improvements in market capitalization by leading to improvements in actual key actions. With regard to key actions, I concluded that it is difficult to expect that the implementation of individual shareholder return policies alone will lead to an increase in market capitalization, and that systematic implementation of such policies in the context of growth and capital allocation management policies is required. This analysis is based on a specific period of time, and it remains to be seen whether similar results will be obtained in other periods, and whether the company’s future efforts may prove to be a more promising sign. In any case, this analysis should be continued.
Aki Matsumoto, CFA
Please see detail research the following links.
http://www.metrical.co.jp/
Please feel free to contact the below email address if any interest or query.
Aki Matsumoto, CFA
Executive Director
Metrical Inc.
akimatsumoto@metrical.co.jp
http://www.metrical.co.jp/jp-home/