CG Stock Performance (Japan): November 2022

November stocks rallied in favor of the higher U.S. stock market on the back of lower U.S. long-term interest rates. The CG Top 20 stock price underperformed both the TOPIX and JPX400 for the first time in three months.

November stocks began the month buoyed by a buy-back and then rallied on the back of the U.S. stock market, which climbed on the lower long-term U.S. interest rates as investors became more risk oriented due to the FOMC meeting summary released on November 23, which suggested a slowdown in the pace of interest rate hikes. Topix recovered to the 2,000-point level on a closing basis for the first time in about 10 months since January 12. Toward the end of the month, the market remained cautious, anticipating Chairman Powell’s speech and the upcoming employment data.
TOPIX and JPX400 indexes performed well in November, rising 2.94% and 3.36%, respectively. The CG Top 20 stock prices underperformed both indices this month with a gain of 1.47%.
Over the long term since 2014, the CG Top20 continues to outperform both indices by about 2% per year. Note that the CG Top20 has been reassessing its component stocks since July 1. The new individual stocks are listed in the table below.

METRICAL:Reason Behind the Difference in Management Between Family Companies and Others Is the Shareholding

On October 14, the Nikkei Shimbun published an article titled “The Magnetism of “Founder’s Family Companies with Reverse Strategies”: Aggressive Even in a Crisis, Corporate Governance is an Issue.” I would like to think about the points discussed in the article.

The October 14 Nikkei article outlined the following report.
Founding family companies that did not flinch in the face of the crisis and moved to a “reverse strategy” are attracting investors. Companies that made quick management decisions and expanded store openings during the COVID-19 pandemic have been unique in the stock market because of the explosive power of their earnings recovery. Weak governance, which has been a longstanding issue, has also been addressed, and money is flocking to companies that are ahead of the curve.

The Nikkei Stock Average rebounded sharply in the Tokyo market on October 14, ending the day 853 yen higher than the previous day. Compared to the end of last year, it was 6% lower. The market environment remained nervous due to strong concerns about continued U.S. interest rate hikes and economic recession. One company that has seen its share price rise steadily and more than double its appreciation rate is TKP, a major rental meeting room company. In FY02/2021, when face-to-face events decreased due to the Corona disaster, the company fell into the red for the first time since its listing. While reducing fixed costs such as personnel expenses and rent, the company remained on the offensive behind the scenes. The company aggressively purchased prime properties that were undervalued. This “reverse management strategy” is now bearing fruit. With the lifting of restrictions on activities, demand has returned, and the company is back in the black for the March-August period of 2022 for the first time in 3 years. President Takateru Kono, speaking at the October 13 financial results briefing, enthusiastically stated, “We will not only rent out space, but also provide content (such as distribution services) to increase added value.”

Crafting the ‘G’ in ESG: Accountability in the Boardroom

By the Nasdaq Center for Board Excellence ‘ESG & Sustainability’ Insights Council: Helle Bank Jorgensen, CEO, Competent Boards; Amma Anaman, Associate General Counsel and Legal Relationship Manager, U.S. Listings, Nasdaq; Chantal Wessels, CFO, Corporate Platforms, Nasdaq. First published by Nasdaq – reposted by Harvard Law School Forum on Corporate Governance

As investment in environment, social and governance (ESG) gains momentum, investors and stakeholders increasingly expect swift and concrete sustainability initiatives from companies across the globe. But boards have lagged behind the ESG fervor. While 40% of directors were found to be ESG conscious with some level of knowledge in the space, only 8% of board directors were found to be competent and capable of effective, embodied action, according to a 2021 study of the top 100 public corporations internationally.

We recently considered the evolving perspectives in ESG, as well as tools and strategies for boards to meet the ESG expectations of their stakeholders.

CG Top 20 Stock Performance (October 2022)

The stock market closed higher in October, driven by rising U.S. equity prices, which rose on expectations of a slowdown in U.S. policy rate hikes.

The performance of the TOPIX and JPX400 indexes in October was up 5.11% and 5.22%, respectively. Over the long term since 2014, the CG Top 20 continues to outperform both indices by about 2% per year. Note that the CG Top20 has been reassessing its component stocks since July 1. The new individual stocks are listed in the table below.

METRICAL: What Initiatives are Companies with High Valuations Taking?

In my previous article, Transitional companies in the prime market: to increase valuations,” I examined companies that increased their market capitalization over the December 2020-February 2022 period and found that the increase was due to higher valuations. I then examined the initiatives of the companies whose Tobin’s q increased during the period in question. I found that changes in Tobin’s q were closely related to increases in foreign ownership, and that firms with large increases in Tobin’s q showed declines in cash equivalents and total assets, suggesting that firms moved to use their assets more effectively. Related to the effective use of assets, these companies have clearly articulated the balance between investment in growth and shareholder returns in their capital allocation policies and have made efforts to communicate with shareholders and investors. With regard to board practices, the companies that significantly increased their Tobin’s q made notable improvements in ensuring the independence of their independent director ratios and compensation committees, as required by prime market listing standards. It was also inferred that the inclusion of companies that eliminated takeover defenses also contributed to boosting Tobin’s q. In light of these results, I’m now interested in what tends to happen to companies with high valuations in the first place, and would like to examine what efforts have been made to address this issue.

The table below shows the correlation analysis between the change in Metrical Tobin’s q and the change in Profile and Key Performance Indicators. Over the period, changes in Tobin’s q are significantly positively correlated with changes in market capitalization and foreign ownership. This confirms that changes in Tobin’s q (valuation) are closely related to changes in market capitalization and foreign ownership. The change in Tobin’s q also shows a significant negative correlation with the change in cash equivalents and the change in total assets. I find that firms that increased Tobin’s q tended to decrease cash equivalents and total assets during the period in question.

METRICAL: CG Stock Performance (Japan): September 2022

The stock market closed lower in September due to declines in the U.S. and European stock markets on concerns over rising interest rates. The CG Top20 stock price outperformed both the TOPIX and the JPX400 over the month.

The stock market was firm from the second half of the month as the U.S. market rallied in mid-September on the back of lower long-term interest rates in anticipation of a recession in the U.S. economy. Over the long term since 2014, the CG Top 20 has continued to outperform both indices by about 2% per year. Over the long term since 2014, the CG Top20 continues to outperform both indices by about 2% per annum. The CG Top 20 has been reassessed as of July 1. The new individual stocks are listed in the table below.

9/13 “Director Boot Camp” Held by Zoom! Next Courses: 12/1 !

On September 13, BDTI held its English Director Boot Camp via teleconference. The day-long intensive course was attended by 10 highly-experienced and highly interactive participants. The participants heard lectures about corporate governance by Nicholas Benes along with a guest lecture by Andrew Silberman of AMT, and exchanged experiences and opinions. Even during a pandemic, training continued smoothly, with all participants chiming in with insightful comments and questions.

METRICAL:CG Stock Performance (Japan): August 2022

August stock prices rose sharply until the first half of the month as the U.S. stock market rallied on expectations of an early end to monetary tightening in the U.S. Toward the end of the month, the market turned highly volatile as the U.S. stock market fell on the concern about longer-than-expected U.S. monetary tightening. The CG Top 20 outperformed both TOPIX and JPX400 during the month.

Until mid-August, the stock market rallied in favor of the U.S. stock market, which rose on expectations of an early end to the U.S. monetary tightening due to the U.S. economic recession speculation. In the latter half of the month, market volatility increased due to concerns about the U.S. FED’s long-term monetary tightening. The TOPIX and JPX400 indexes gained 1.53% and 1.33%, respectively, during the month of August, while the CG Top20 index outperformed both indices, rising 1.66%. The table below shows the components of the CG Top 20 as reviewed on July 1.

METRICAL: What Factors Most Affect Stock Returns?

The common goal of both company management and shareholders is the sustainable growth of the company’s corporate value. Finding such a company is also an important objective for investors. To explore this, I would like to use the 1,487 comparable companies in the Metrical Universe for the period from the end of December 2020 to the end of February 2022 to explore changes in market capitalization and effective factors during this period.

The table below shows the correlation analysis between changes in market capitalization and changes in the Profile and Key Performance Indicators for the period from the end of December 2020 to the end of February 2022. For the period in question, the change in market capitalization shows a significant positive correlation with the change in total assets, the change in foreign ownership, and the change in Tobin’s q. This indicates that companies with higher market capitalization tend to have higher total assets, higher foreign ownership ratios, and higher Tobin’s q. Behind the increase in market capitalization, it makes sense that Tobin’s q, which represents valuations, would increase. It is also natural that there is a correlation between changes in the foreign shareholding ratio and changes in market capitalization in the Tokyo stock market, where foreign investor trading has a strong presence. As for the correlation between changes in total assets and changes in market capitalization, one factor may be the increase in assets supporting earnings growth, but this remains to be examined. On the other hand, change in market capitalization did not show a significant positive correlation with change in cash equivalents, change in ROE, or change in ROA. It can be seen that in the period in question, the change in profitability on an actual basis over the past 3 years did not have much impact on the change in market capitalization.

METRICAL: Considerations Regarding Retirement of Treasury Stock

I am sure you are aware that the number of companies moving to retire treasury stock is gradually increasing due to prime market listing standards. In my previous article, Metrical’s analysis has also revealed that companies that have retired treasury stock three or more times are also more positive in their corporate governance efforts. If share repurchases are a sign that corporate governance initiatives and performance improvement are working in tandem, it is very welcome. I would like to think more about how the actual action taken by the company to retire its own shares relates to corporate governance.

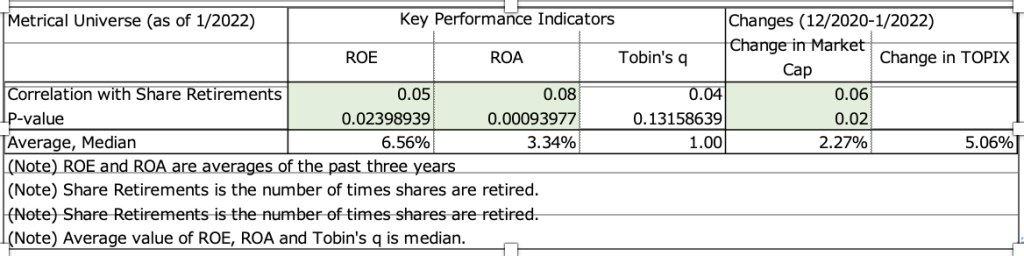
The table below shows the correlation between the frequency of share buybacks and ROE, ROA, and Tobin’s q for the Metrical Universe (as of 1/2022). As shown in the previous article, a highly significant positive correlation between the frequency of share buybacks and ROE and ROA has been confirmed, indicating that the more frequently a company retires its own shares, the higher its ROE and ROA.

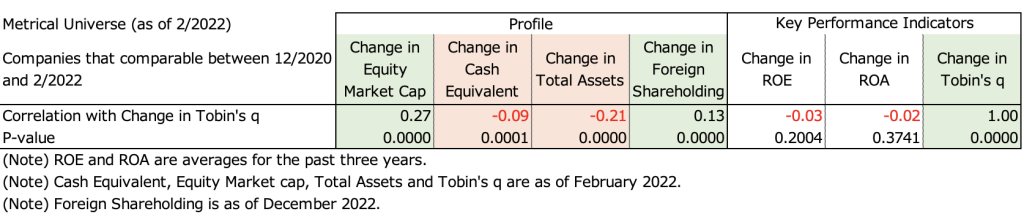
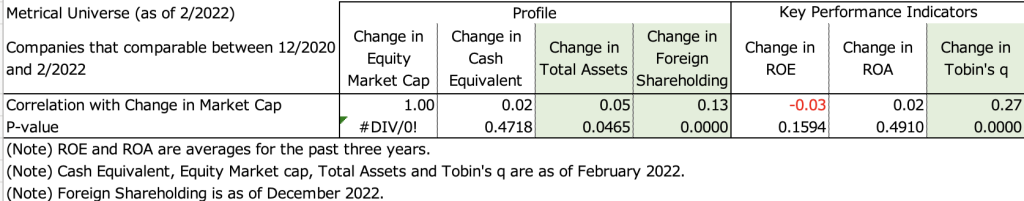
This result seems reasonable, because to cancel treasury stock, a company has to buy back its own shares, which has a positive effect on ROE and ROA. On the other hand, the correlation between Tobin’s q and the frequency of share repurchases is not shown to be significant. This means that a company that retires its own shares more frequently does not have a higher stock price valuation, which means that a company that retires its own shares does not have a significant relationship with its stock price valuation. Although the company buys back its own shares before retiring them, this result is also reasonable because the company does not take Tobin’s q (P/B) into account when making its decision to buy back its own shares. On the other hand, it is interesting to note that there is a highly significant positive correlation between the rate of change in market capitalization (12/2021-1/2022) and the frequency of stock repurchases. Even though the frequency of share buybacks is not correlated with respect to stock price premium or discount, it is related to the rate of change in market capitalization over the period 12/2021-1/2022. Over this 13-month period, the more frequent the company’s share retirement (or stock repurchase), the greater the increase in market capitalization. The results show that stock retirement was associated with an increase in market capitalization over this period.