Solving Gender Gap in Higher Education Is Key, as Political Leadership Can’t Be Count On

The World Economic Forum (WEF) released its Gender Gap Report on June 21. I would like to discuss Japan’s ranking in the Gender Gap Index.

Japan’s ranking in the Gender Gap Index is as follows.
Among the G7 countries, Germany was the top-ranked country in 6th place, up four places from 10th the previous year. It was followed by the United Kingdom (15th), Canada (30th), France (40th), the United States (43rd), and Italy (79th). Japan was the only country that did not even make the top 100, falling nine places from 116th the previous year to its lowest ranking ever. The percentage of women in parliamentary and ministerial positions is low, and the country is in the lowest group in the political field, ranking 138th. Japan also ranked 123rd in the economic field, reflecting the labor participation rate and the gender gap in wages. In the education sector, the country also fell in rank to 47th place due to a lower enrollment rate of women in higher education.

The Gender Equality Bureau of the Cabinet Office, which promotes “women’s activities” rather than gender equality, usually posts a statement on the Gender Gap Index on its website, but although Japan’s ranking in the Gender Gap Index of 125th/146th countries (announced on June 21, 2023) is posted, the rankings for each field have not yet updated as of June 24.

Discussion Point 1: “Japan’s ranking in the Gender Gap Index is 125th/146th, a drop of nine places from 116th place last year and a record low.”
Since the Gender Gap Index rankings are relative, it is only natural that the country’s ranking would be lower than the speed at which the gender gap in other countries is improving. The main reason for this is that the ranking in the areas of “Politics” and “Economy” has not improved at all from its very low ranking position, compared to “Education” (99.7%) and “Access to Health Care” (97.3%), when looked at by sector.

METRICAL: Share Buybacks Are Likely Due to Reduction of Shares in Retirement Benefit Trusts and Policy Holdings

Since the disclosure regarding retirement benefit trusts was made by NSK on April 20, I would like to share my thoughts on the issue of policy shareholdings and deemed shareholdings held in retirement benefit trusts.

On April 20, NSK issued a disclosure titled “Notice of Partial Return of Retirement Benefit Trust.” The contents of this disclosure were as follows: “The pension assets including the retirement benefit trust are significantly overfunded in relation to the retirement benefit obligation, and this situation is expected to continue in the future, so we sold part of the shares in the trust in the fiscal year ending March 31, 2023. The partial return of the retirement benefit trust is expected to result in an extraordinary gain of approximately 10 billion yen in the non-consolidated accounts (there will be no impact on the consolidated income statement for the fiscal year ending March 31, 2024).”

METRICAL : CG Stock Performance (Japan) for April 2023

The solid U.S. stock market, which has settled down from last month’s financial system unrest, led Japanese stocks to move higher toward the end of the month.
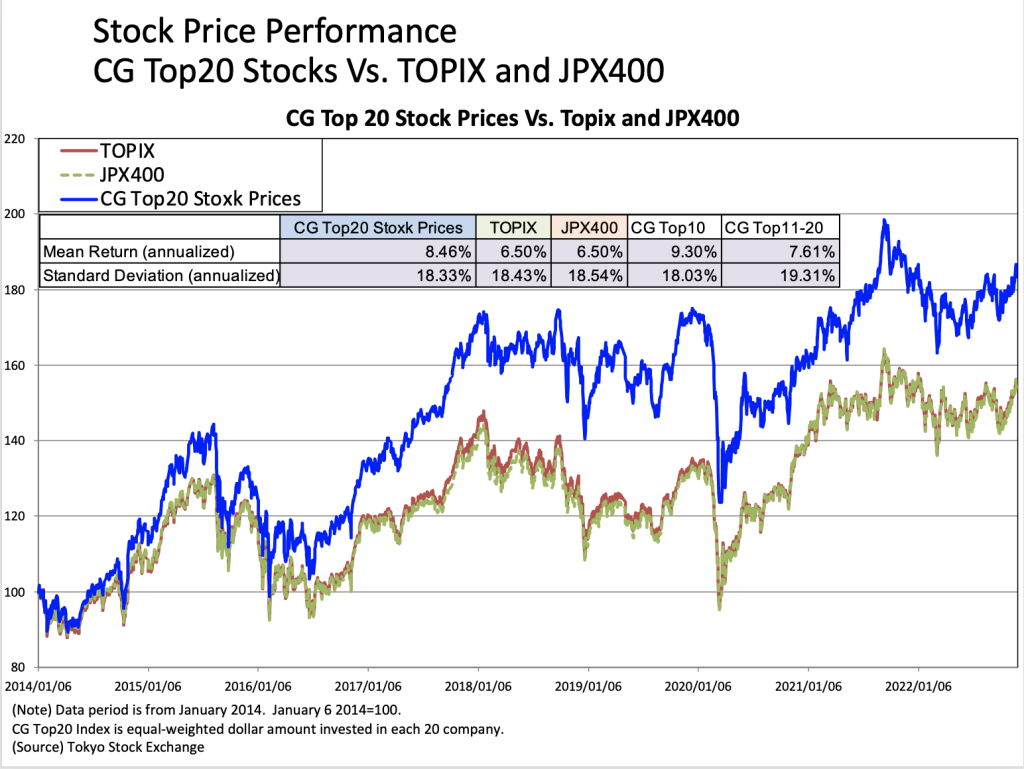
The CG Top20 stock price index significantly outperformed both TOPIX and JPX400 for the second consecutive month.

The stock market rallied toward the end of the month on the strength of U.S. stock prices as U.S. stocks gradually calmed down from the financial system unrest triggered by the failure of the Silicon Valley Bank in the U.S. On the last day of the month, the Bank of Japan’s monetary policy meeting maintained monetary easing, and stock prices rose sharply.

METRICAL: How Far Has Corporate Governance Progressed in 2022? (1) ~ Board Practices Section

Metrical provides monthly corporate governance assessments of approximately 1,700 companies with market capitalization exceeding approximately 10 billion yen, primarily those listed on the TSE 1st Section. This year, continuing on from last year, I would like to see how far listed companies have progressed in their corporate governance efforts over the past year.

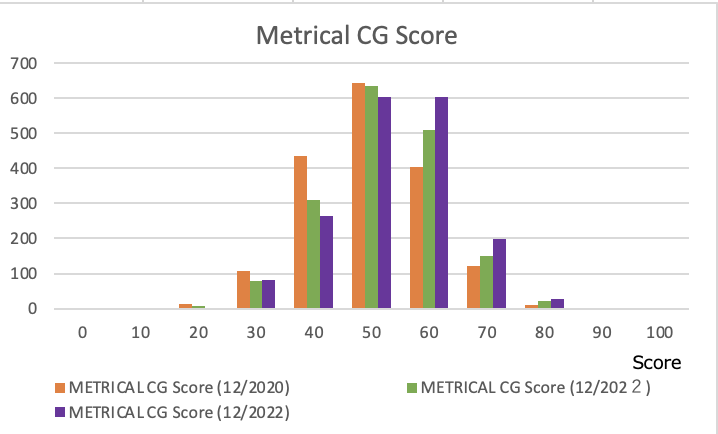
The chart below shows the changes in each of the evaluation items for approximately 1,700 companies in the Metrical Universe over the past 3 years (December 2020, December 2021, and December 2022). Metrical divides the evaluation items into Board Practices and Key Actions. This time, I will look at the Board Practices section. Let’s take a look at them in order.

The first chart shows the distribution of Metrical CG scores, which represent the overall corporate governance rating of a listed company across a number of corporate governance measures. The distribution of scores in December 2022 is indicated by purple bars. distribution of the bars shows that the distribution of the bars moves to the right (toward higher scores) with each subsequent year, from December 2020, December 2021, and December 2022. It can be inferred that listed companies have advanced their corporate governance initiatives in response to the revision of the Corporate Governance Code in 2021 and the market reorganization of the TSE in 2022. Let’s take a look at the contents of these efforts by evaluation item below.

METRICAL: CG Stock Performance (Japan): December 2022

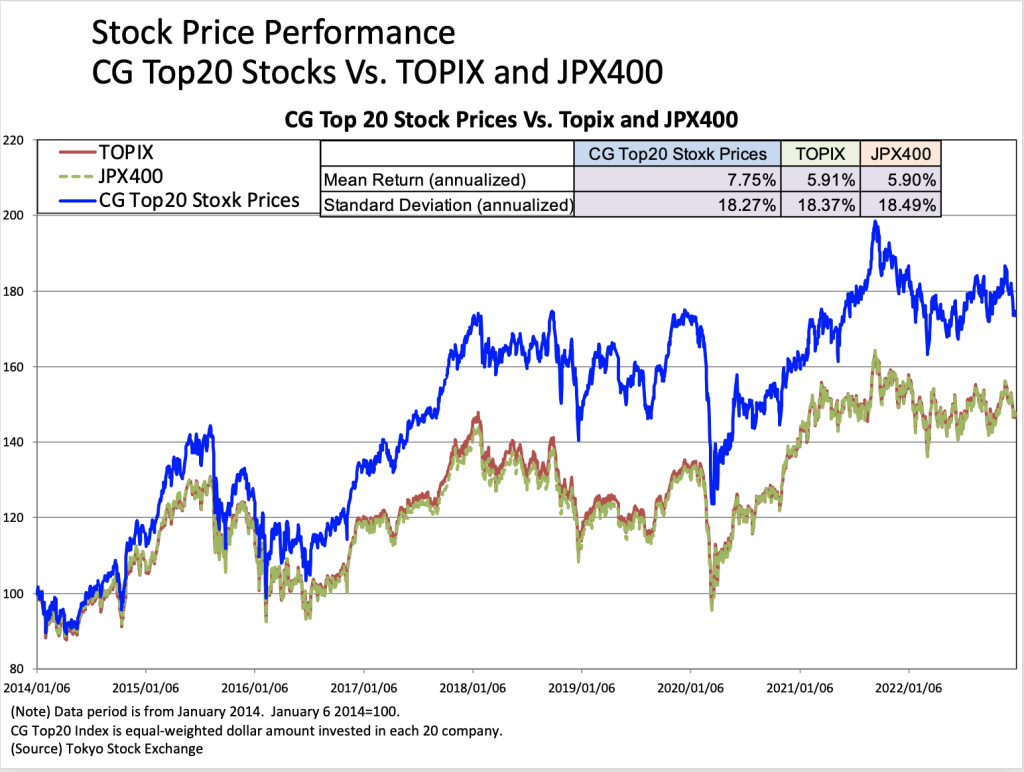
The stock market ended December with a sharp decline after the Bank of Japan announced operational revisions to its interest rate operations at its monetary policy meeting. The CG Top20 stocks underperformed both the TOPIX and JPX400 for the second month in a row.

December stock market was unable to find a sense of direction until the middle of the month as investors watched the monetary policy of the U.S. FOMC meeting. The stock market fell sharply immediately after the Bank of Japan decided to expanded the range of the long-term interest rates from 0.25% to 0.5% at its monetary policy meeting on December 20. After that, stocks closed lower with no sign of a rebound. While bank stocks rose sharply in response to the interest rate hike, notable declines were seen in other stocks, especially growth stocks.
The TOPIX and JPX400 indexes fell -4.79% and -4.87%, respectively, in December performance. The CG Top20 stock index underperformed against both indices, falling -5.59%. Over the long term since 2014, the CG Top20 continues to outperform both indices by about 2% per year. The CG Top 20 stocks have been revised on July 1. The new components are listed in the table below.

METRICAL: Mismatch Between Documents Needed by Foreign Investors and Those Translated in English by Companies

The TSE disclosed the Survey of the Status of Disclosure in English as of the end of July 2022 on August 3, 2022, and I would like to discuss the issues.

At the beginning of the disclosure document, the TSE states the following In the beginning of the disclosure report: “In order to clarify the situation after the transition to the new market classification in April 2022, we conducted a survey as of July 2022 and compiled the results of the survey. For companies listed on the Prime Market, a market for companies focused on constructive dialogue with global investors, the percentage of companies disclosing in English reached 92.1% (85.8% as of December 31, 2021), indicating that listed companies have made some progress in English-language disclosure since the transition to the new market classification. On the other hand, even for timely disclosure documents (excluding financial statements) and annual securities reports, which were required to be disclosed in English by more than 70% in the survey of overseas investors conducted last year, the percentage of companies listed on the prime market that disclose in English is still less than half. The Corporate Governance Code, which has been in effect since the transition to the new market classification, states that “Prime market listed companies, in particular, should disclose and provide required information in English in their disclosure documents” (the second sentence of Supplementary Principle 3-1). Further progress is expected toward expanding the scope and content of English-language disclosure and eliminating differences in the timing of disclosure.”

As stated in the statement in the TSE’s summary of survey results above, many listed companies in the prime market translate some documents into English. The increase in the number of companies disclosing in English can be evaluated to a certain extent. However, the fact is that the TSE has only just begun, and as the TSE also states in the latter part of the statement, very few companies are disclosing important disclosure documents, such as annual securities reports, in English. The importance of the annual securities report is further increased by the fact that sustainability items are planned to be included in the report from the next fiscal year, instead of being submitted quarterly. Below are the results of TSE’s survey.

CG Stock Performance (Japan): November 2022

November stocks rallied in favor of the higher U.S. stock market on the back of lower U.S. long-term interest rates. The CG Top 20 stock price underperformed both the TOPIX and JPX400 for the first time in three months.

November stocks began the month buoyed by a buy-back and then rallied on the back of the U.S. stock market, which climbed on the lower long-term U.S. interest rates as investors became more risk oriented due to the FOMC meeting summary released on November 23, which suggested a slowdown in the pace of interest rate hikes. Topix recovered to the 2,000-point level on a closing basis for the first time in about 10 months since January 12. Toward the end of the month, the market remained cautious, anticipating Chairman Powell’s speech and the upcoming employment data.
TOPIX and JPX400 indexes performed well in November, rising 2.94% and 3.36%, respectively. The CG Top 20 stock prices underperformed both indices this month with a gain of 1.47%.
Over the long term since 2014, the CG Top20 continues to outperform both indices by about 2% per year. Note that the CG Top20 has been reassessing its component stocks since July 1. The new individual stocks are listed in the table below.

METRICAL:Reason Behind the Difference in Management Between Family Companies and Others Is the Shareholding

On October 14, the Nikkei Shimbun published an article titled “The Magnetism of “Founder’s Family Companies with Reverse Strategies”: Aggressive Even in a Crisis, Corporate Governance is an Issue.” I would like to think about the points discussed in the article.

The October 14 Nikkei article outlined the following report.
Founding family companies that did not flinch in the face of the crisis and moved to a “reverse strategy” are attracting investors. Companies that made quick management decisions and expanded store openings during the COVID-19 pandemic have been unique in the stock market because of the explosive power of their earnings recovery. Weak governance, which has been a longstanding issue, has also been addressed, and money is flocking to companies that are ahead of the curve.

The Nikkei Stock Average rebounded sharply in the Tokyo market on October 14, ending the day 853 yen higher than the previous day. Compared to the end of last year, it was 6% lower. The market environment remained nervous due to strong concerns about continued U.S. interest rate hikes and economic recession. One company that has seen its share price rise steadily and more than double its appreciation rate is TKP, a major rental meeting room company. In FY02/2021, when face-to-face events decreased due to the Corona disaster, the company fell into the red for the first time since its listing. While reducing fixed costs such as personnel expenses and rent, the company remained on the offensive behind the scenes. The company aggressively purchased prime properties that were undervalued. This “reverse management strategy” is now bearing fruit. With the lifting of restrictions on activities, demand has returned, and the company is back in the black for the March-August period of 2022 for the first time in 3 years. President Takateru Kono, speaking at the October 13 financial results briefing, enthusiastically stated, “We will not only rent out space, but also provide content (such as distribution services) to increase added value.”

CG Top 20 Stock Performance (October 2022)

The stock market closed higher in October, driven by rising U.S. equity prices, which rose on expectations of a slowdown in U.S. policy rate hikes.

The performance of the TOPIX and JPX400 indexes in October was up 5.11% and 5.22%, respectively. Over the long term since 2014, the CG Top 20 continues to outperform both indices by about 2% per year. Note that the CG Top20 has been reassessing its component stocks since July 1. The new individual stocks are listed in the table below.

METRICAL: What Initiatives are Companies with High Valuations Taking?

In my previous article, Transitional companies in the prime market: to increase valuations,” I examined companies that increased their market capitalization over the December 2020-February 2022 period and found that the increase was due to higher valuations. I then examined the initiatives of the companies whose Tobin’s q increased during the period in question. I found that changes in Tobin’s q were closely related to increases in foreign ownership, and that firms with large increases in Tobin’s q showed declines in cash equivalents and total assets, suggesting that firms moved to use their assets more effectively. Related to the effective use of assets, these companies have clearly articulated the balance between investment in growth and shareholder returns in their capital allocation policies and have made efforts to communicate with shareholders and investors. With regard to board practices, the companies that significantly increased their Tobin’s q made notable improvements in ensuring the independence of their independent director ratios and compensation committees, as required by prime market listing standards. It was also inferred that the inclusion of companies that eliminated takeover defenses also contributed to boosting Tobin’s q. In light of these results, I’m now interested in what tends to happen to companies with high valuations in the first place, and would like to examine what efforts have been made to address this issue.

The table below shows the correlation analysis between the change in Metrical Tobin’s q and the change in Profile and Key Performance Indicators. Over the period, changes in Tobin’s q are significantly positively correlated with changes in market capitalization and foreign ownership. This confirms that changes in Tobin’s q (valuation) are closely related to changes in market capitalization and foreign ownership. The change in Tobin’s q also shows a significant negative correlation with the change in cash equivalents and the change in total assets. I find that firms that increased Tobin’s q tended to decrease cash equivalents and total assets during the period in question.