The common goal of both company management and shareholders is the sustainable growth of the company’s corporate value. Finding such a company is also an important objective for investors. To explore this, I would like to use the 1,487 comparable companies in the Metrical Universe for the period from the end of December 2020 to the end of February 2022 to explore changes in market capitalization and effective factors during this period.
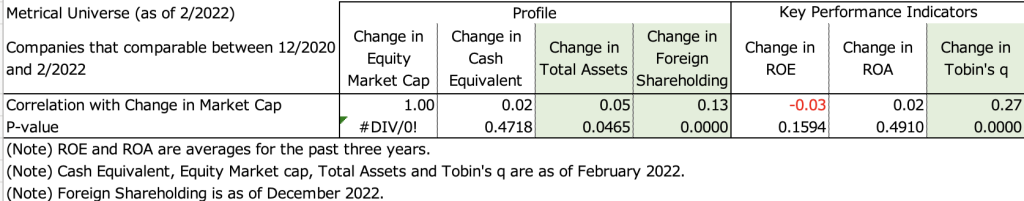
The table below shows the correlation analysis between changes in market capitalization and changes in the Profile and Key Performance Indicators for the period from the end of December 2020 to the end of February 2022. For the period in question, the change in market capitalization shows a significant positive correlation with the change in total assets, the change in foreign ownership, and the change in Tobin’s q. This indicates that companies with higher market capitalization tend to have higher total assets, higher foreign ownership ratios, and higher Tobin’s q. Behind the increase in market capitalization, it makes sense that Tobin’s q, which represents valuations, would increase. It is also natural that there is a correlation between changes in the foreign shareholding ratio and changes in market capitalization in the Tokyo stock market, where foreign investor trading has a strong presence. As for the correlation between changes in total assets and changes in market capitalization, one factor may be the increase in assets supporting earnings growth, but this remains to be examined. On the other hand, change in market capitalization did not show a significant positive correlation with change in cash equivalents, change in ROE, or change in ROA. It can be seen that in the period in question, the change in profitability on an actual basis over the past 3 years did not have much impact on the change in market capitalization.