by David Snoddy, CEO of Nezu Asia
SUMMARY
The nature of Japan’s relationship with equity market capitalism changed significantly from the first decade to the second of the 21st century. The first decade, particularly after the resignation of PM Koizumi in 2006, was often characterized by open conflict, with the most obvious examples being the arrest and conviction of shareholder activists Horie and Murakami, and the legal and regulatory attacks on both the consumer finance and leveraged real estate businesses (among others). However, approximately around 2011, the attitude of both government and the public morphed into something more resembling symbiosis than conflict. In the third decade of this century the symbiosis mode seems still to be ascendant.
Many of the top-down aspects of this shift have been well documented and discussed both in Japan and in the West – from the 2015 Corporate Code, to the 2014 Fiduciary Code and the emerging catalysts created by the rule set for Tokyo’s new “Prime” market. From the perspective of governance per se, there have been some concrete steps “backwards” (with the Toshiba drama a prime example). However, the cumulative effect of the change in the regulatory suasion regime in Japan is such that it is difficult to find equity market participants who believe that the governance environment in 2021, on average, is not noticeably more shareholder-friendly than it was 10 years ago.
Over the same period there has also been a dramatic shift in trends in Japanese equity price formation. This is not well documented or understood. But it is in fact the micro expression of the same impulses which are driving the “macro” changes in the regulatory regime. Since 2011, there has been a marked change in how the market “votes with its feet” – rewarding companies who conform to the new desired profile, and punishing those who don’t. Specifically, capital efficiency and, to a slightly lesser extent, revenue growth, have captured outsized returns.
The top-down changes in the regulatory regime are on one side of the coin. The bottom-up changes in price formation are the other side of the same coin.
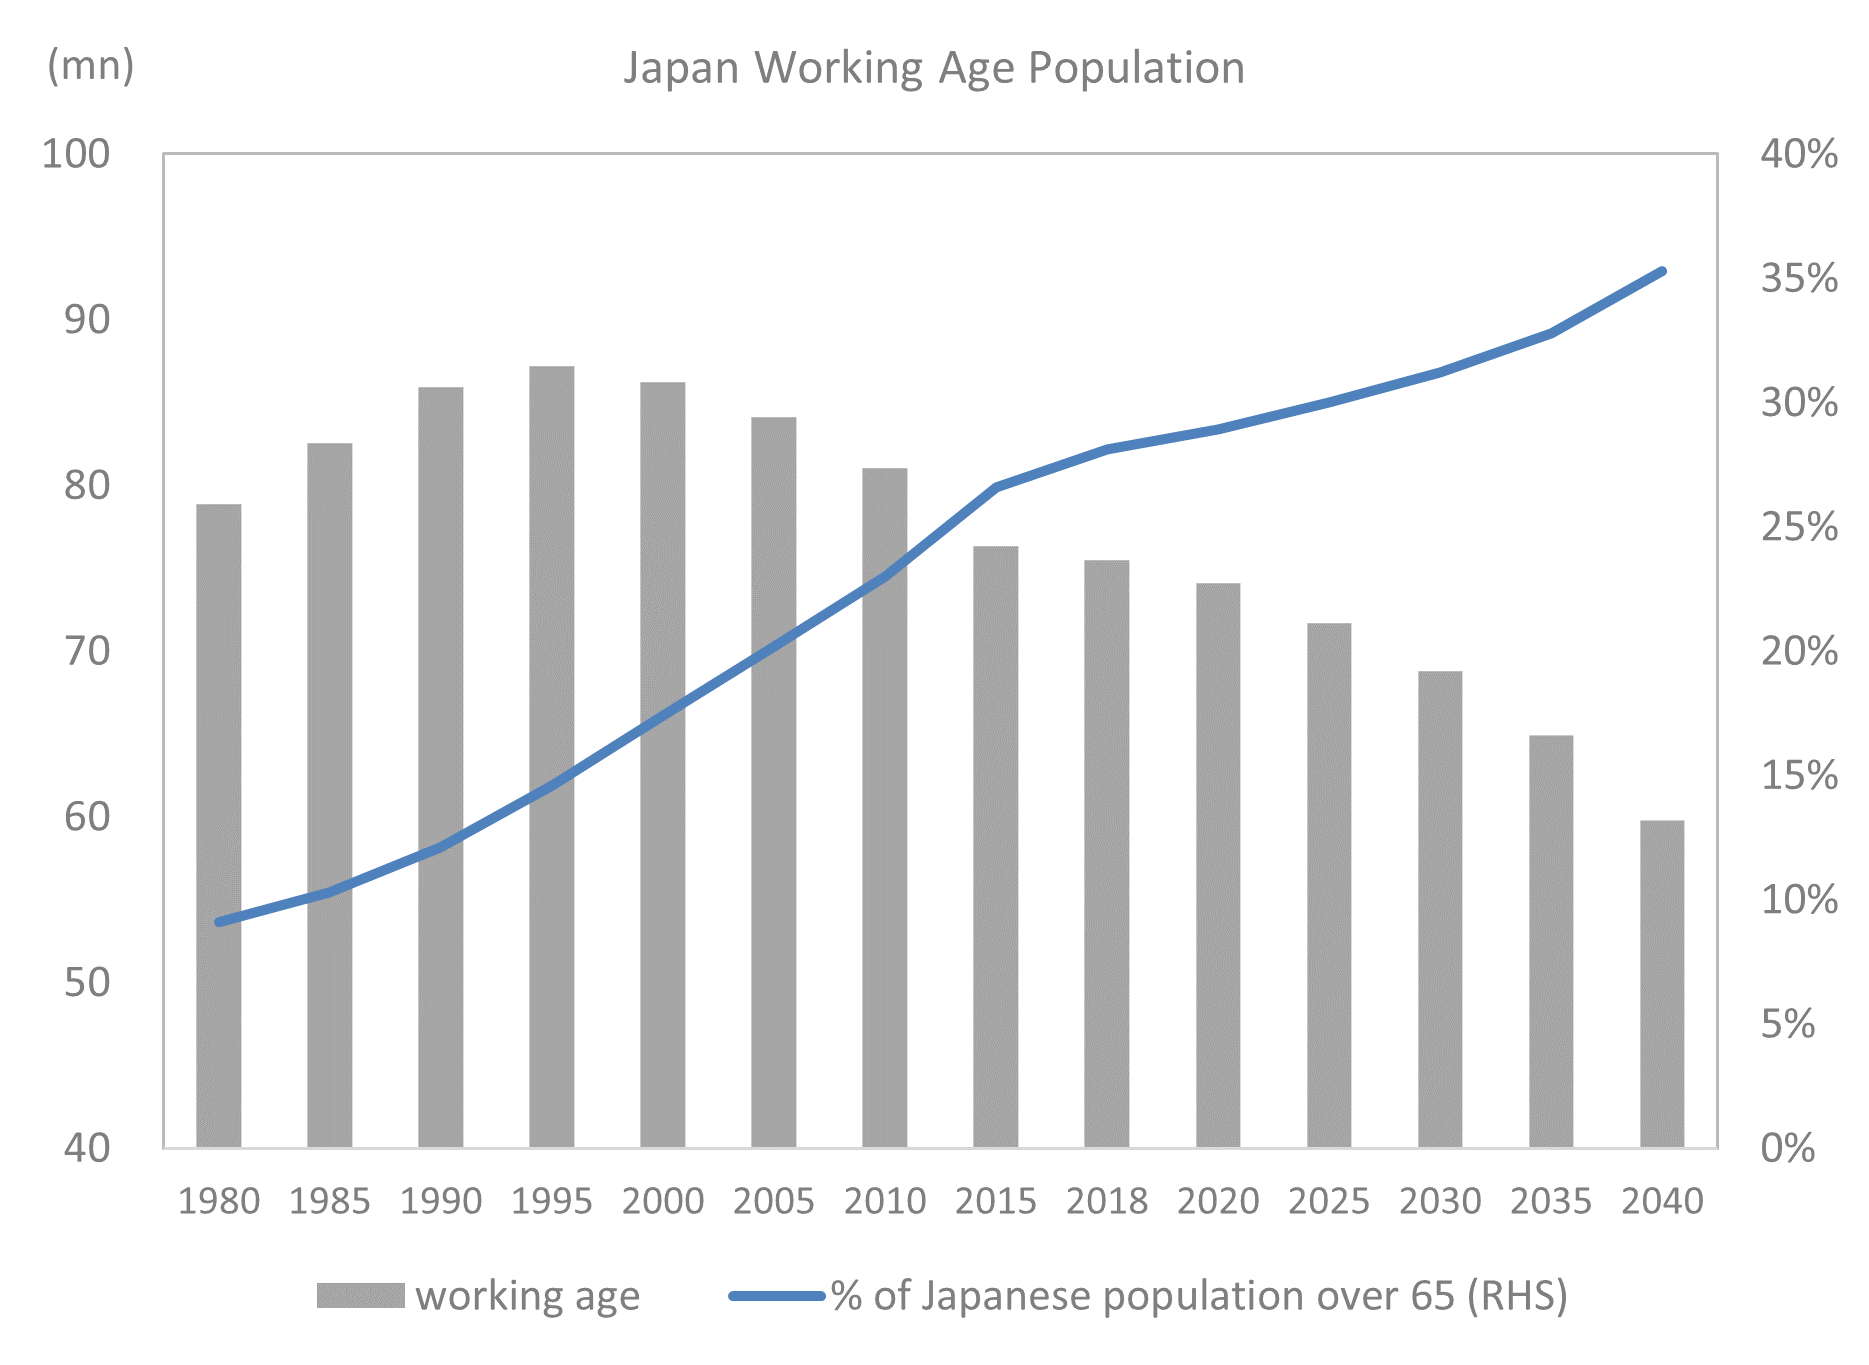
The socio-economic function of equity capitalism in Japan is somewhat uncomfortably positioned between two massive sources of pressure. On the one hand, the aging of Japan’s society is slowly turning active employees into pensioners who, either directly or indirectly, depend on financial income to maintain their living standards. This economic pressure provides the core motivation for the changes in Japan’s approach to equity capitalism – both from the top and the bottom. One the other hand, there is a near-consensus social desire to protect and maintain the lifetime employment system, albeit only for a subset of employees. Predictably, these two pressures are often in conflict, which accounts for some of the peculiarities of “equity capitalism with Japanese characteristics.”
The social commitment to maintain the lifetime employment system predates all of the data to be presented here. The demographic challenges posed by the aging of society have been building for a generation or so, but it was only after 2011 that they resulted in a shift towards a noticeably more cooperative approach to equity markets.
Although my goal is here is to describe the “how” more than the “why,” I do believe the proximate cause of that shift – the “straw that broke the camel’s back” – was the 2011 Tohoku earthquake, which took more lives in one day than the coronavirus has in over 18 months, and showcased both public and private sector incompetence on a scale not seen since WWII. As was the case at other junctures of extreme change over the last 200 years, in 2011 many Japanese perceived their society to be beaten, weak, and at risk – and so the nation changed course.
This chart highlights the demographic challenges facing Japan:
Exhibit 1: Japan Working Age Population
The data analyzed in this paper allow for the following observations about the post-2011 Japanese equity market:
1) Beginning roughly 9 months after the Tohoku earthquake, Japanese equity pricing has fairly consistently rewarded capital efficiency and punished its absence. As I will show, this did not happen in the decade before 2011. In an economy with minimal nominal growth, company revenue growth has played a supporting – but important – role in the same process.
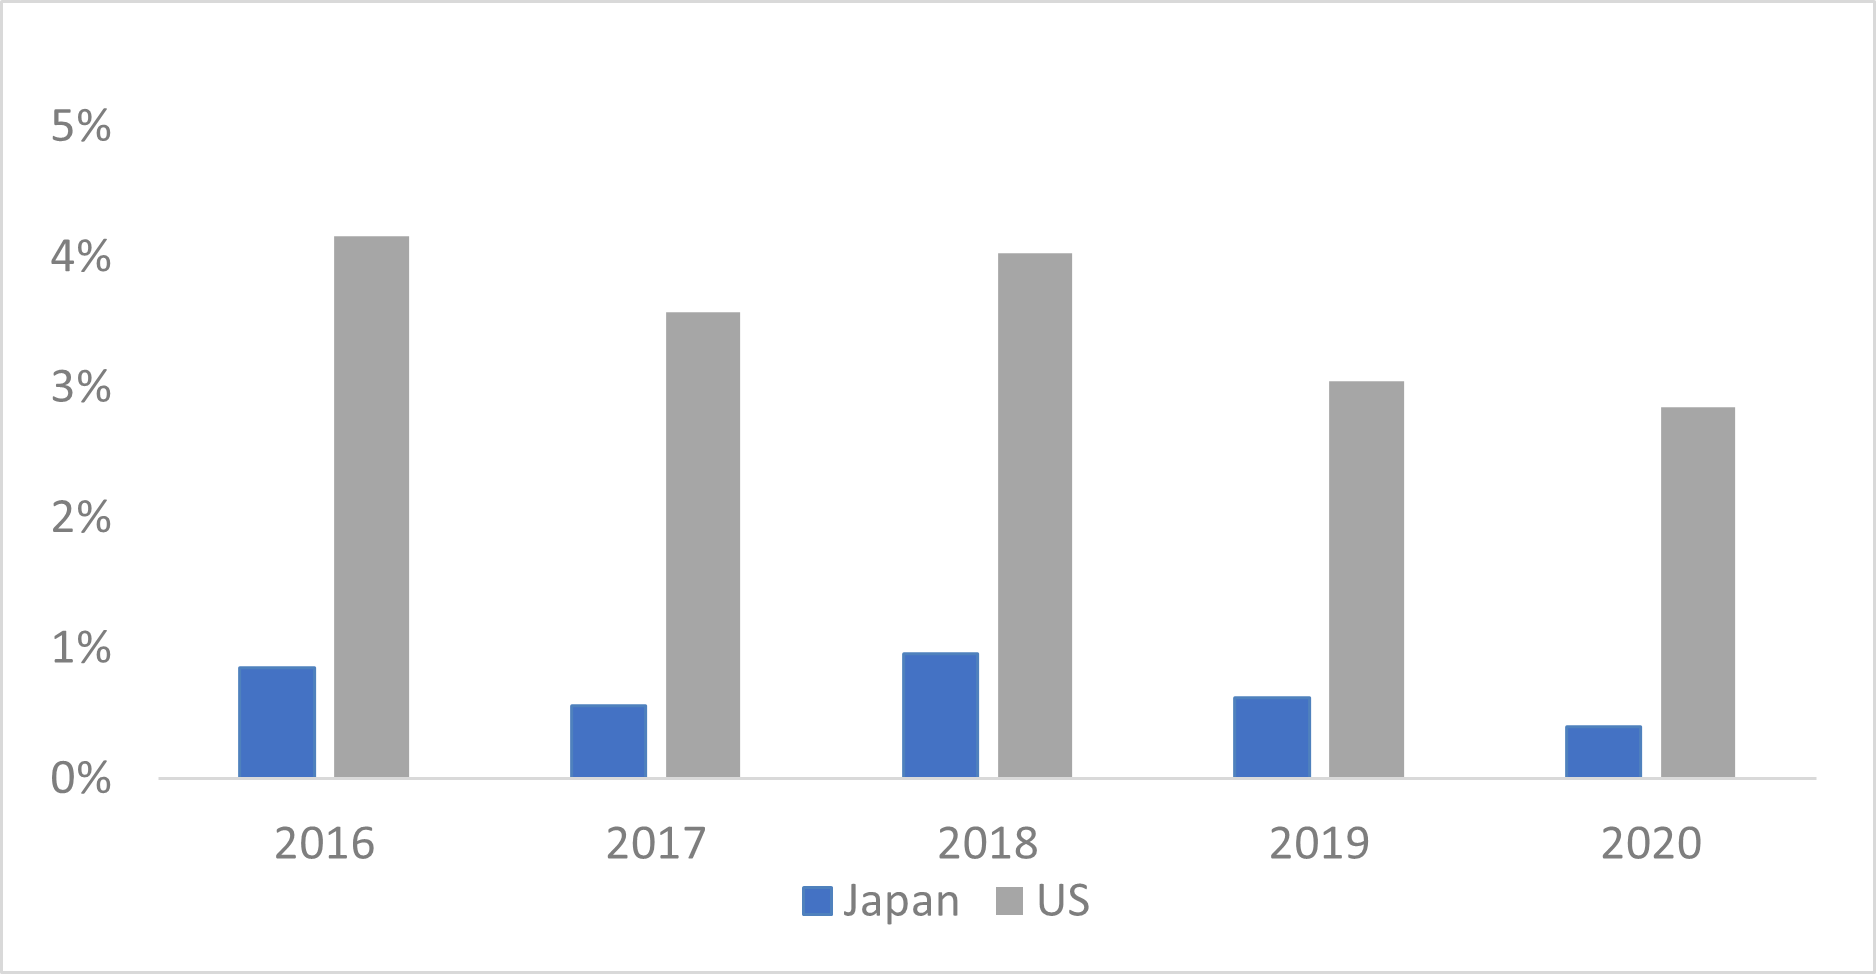
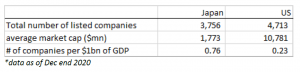
2) The lifetime employment system creates a different set of “Japan rules” for incentivizing managements and investors. One result is a distinct lack of consolidation relative to the US: the GDP represented by each listed Japanese company is about 1/3 of the US number. A second result is that there is a strong correlation in Japan between the number of years since the company was founded and the company’s profitability – because lifetime employment makes it very difficult to change a bad company culture into a good one. In other words, you are better off starting a new company than trying to fix an old one. This is also reflected, thirdly, in the high precision with which, after 2011, the Japanese market began to price relatively small differentials in ROE – indicating one or both of a) an assumption of higher ROE stickiness in Japan than in other developed markets or b) a belief that ROE improvement is most likely to come from those with above average ROE already. Which has in fact been the case.
3) Fumio Kishida, Japan’s new prime minister, has made several comments about taxing the retained earnings of Japan’s many over-capitalized companies. This is may be an idle threat, but there is a legitimate target. Japan’s highest ROA cohort typically have equity ratios (total equity/total assets) roughly twice as high as you find in the high ROA cohort in other developed markets.
4) In the early stages of the post-earthquake market, there were relatively few listed capital-efficient companies with appreciable topline growth. That has changed markedly over the last decade, as the good have gotten better and strong new companies have come to market. I will close with a brief demographic analysis of this group of companies.
All of the data presented here is for publicly listed companies only. Wherever possible, I will let the data speak for itself and keep my commentary short.
ANALYSIS
Ten years ago, there was a major shift in Japanese equity price formation
Beginning roughly 9 months after the Tohoku earthquake, Japanese equity pricing has fairly consistently rewarded capital efficiency and punished its absence. The much discussed 2014 Ito Report (which recommended a minimum 8% ROE for listed Japan), added academic credibility to the regulatory regime shift, but the change in price formation predated the report itself:
Exhibit 2: Excess return: ROE
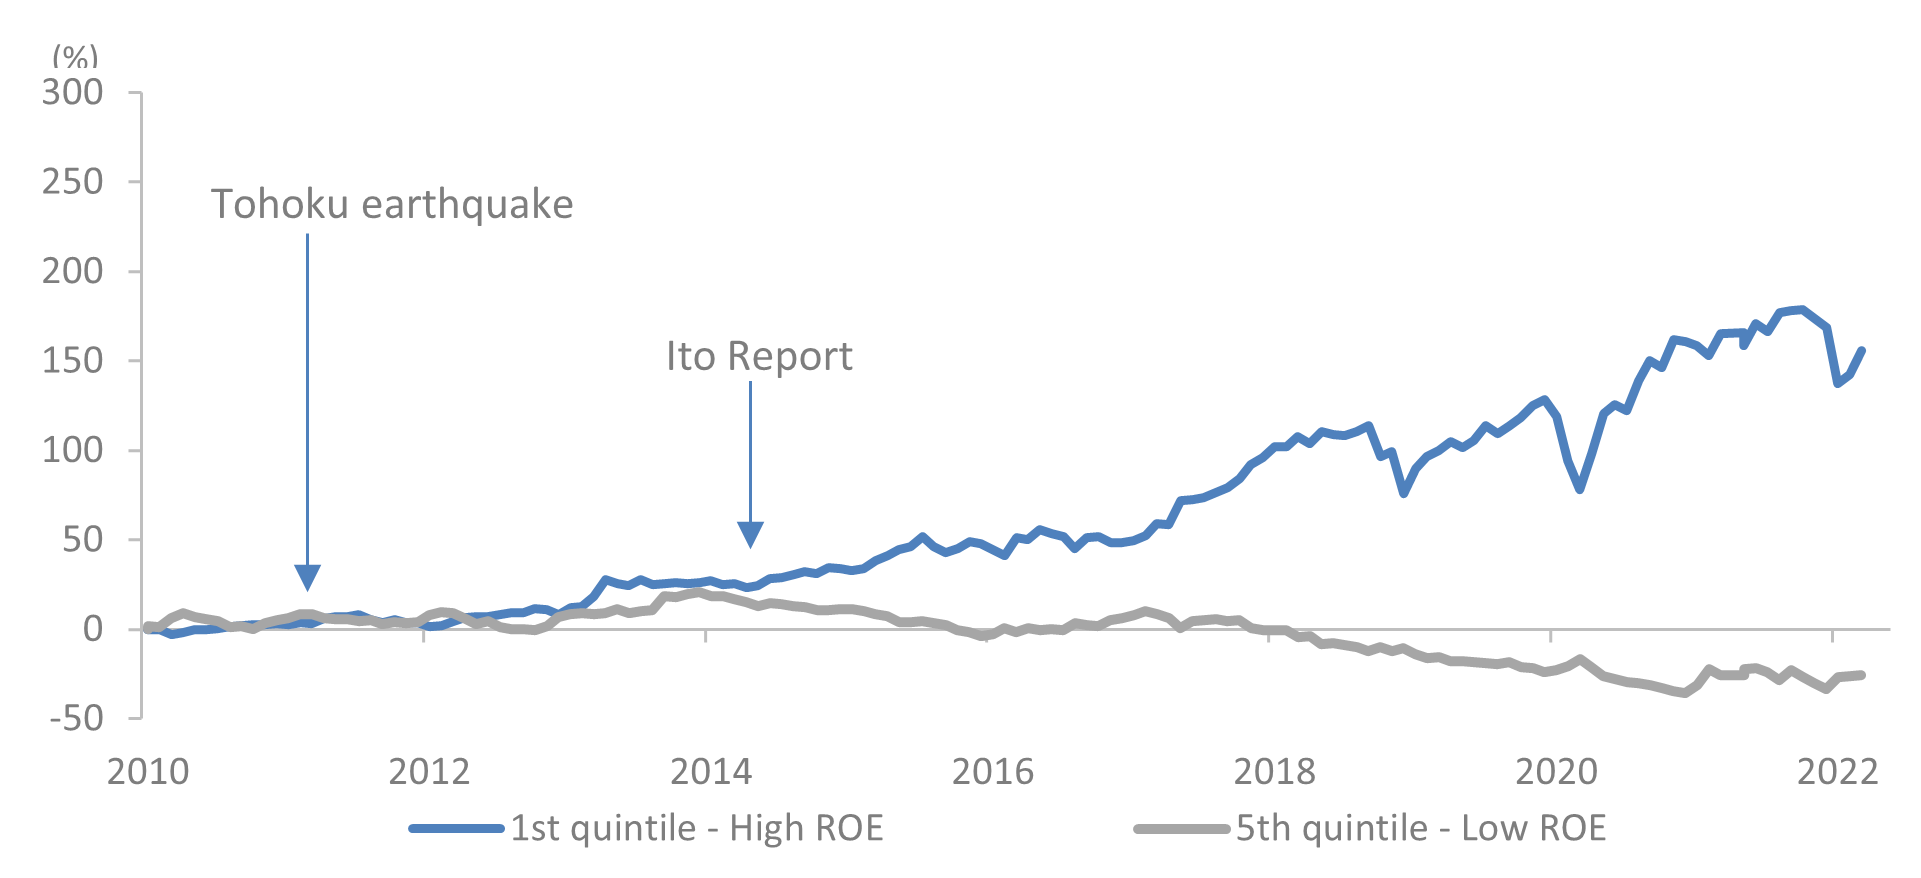
Exhibit 3: Excess return: ROE + OPM + Sales growth
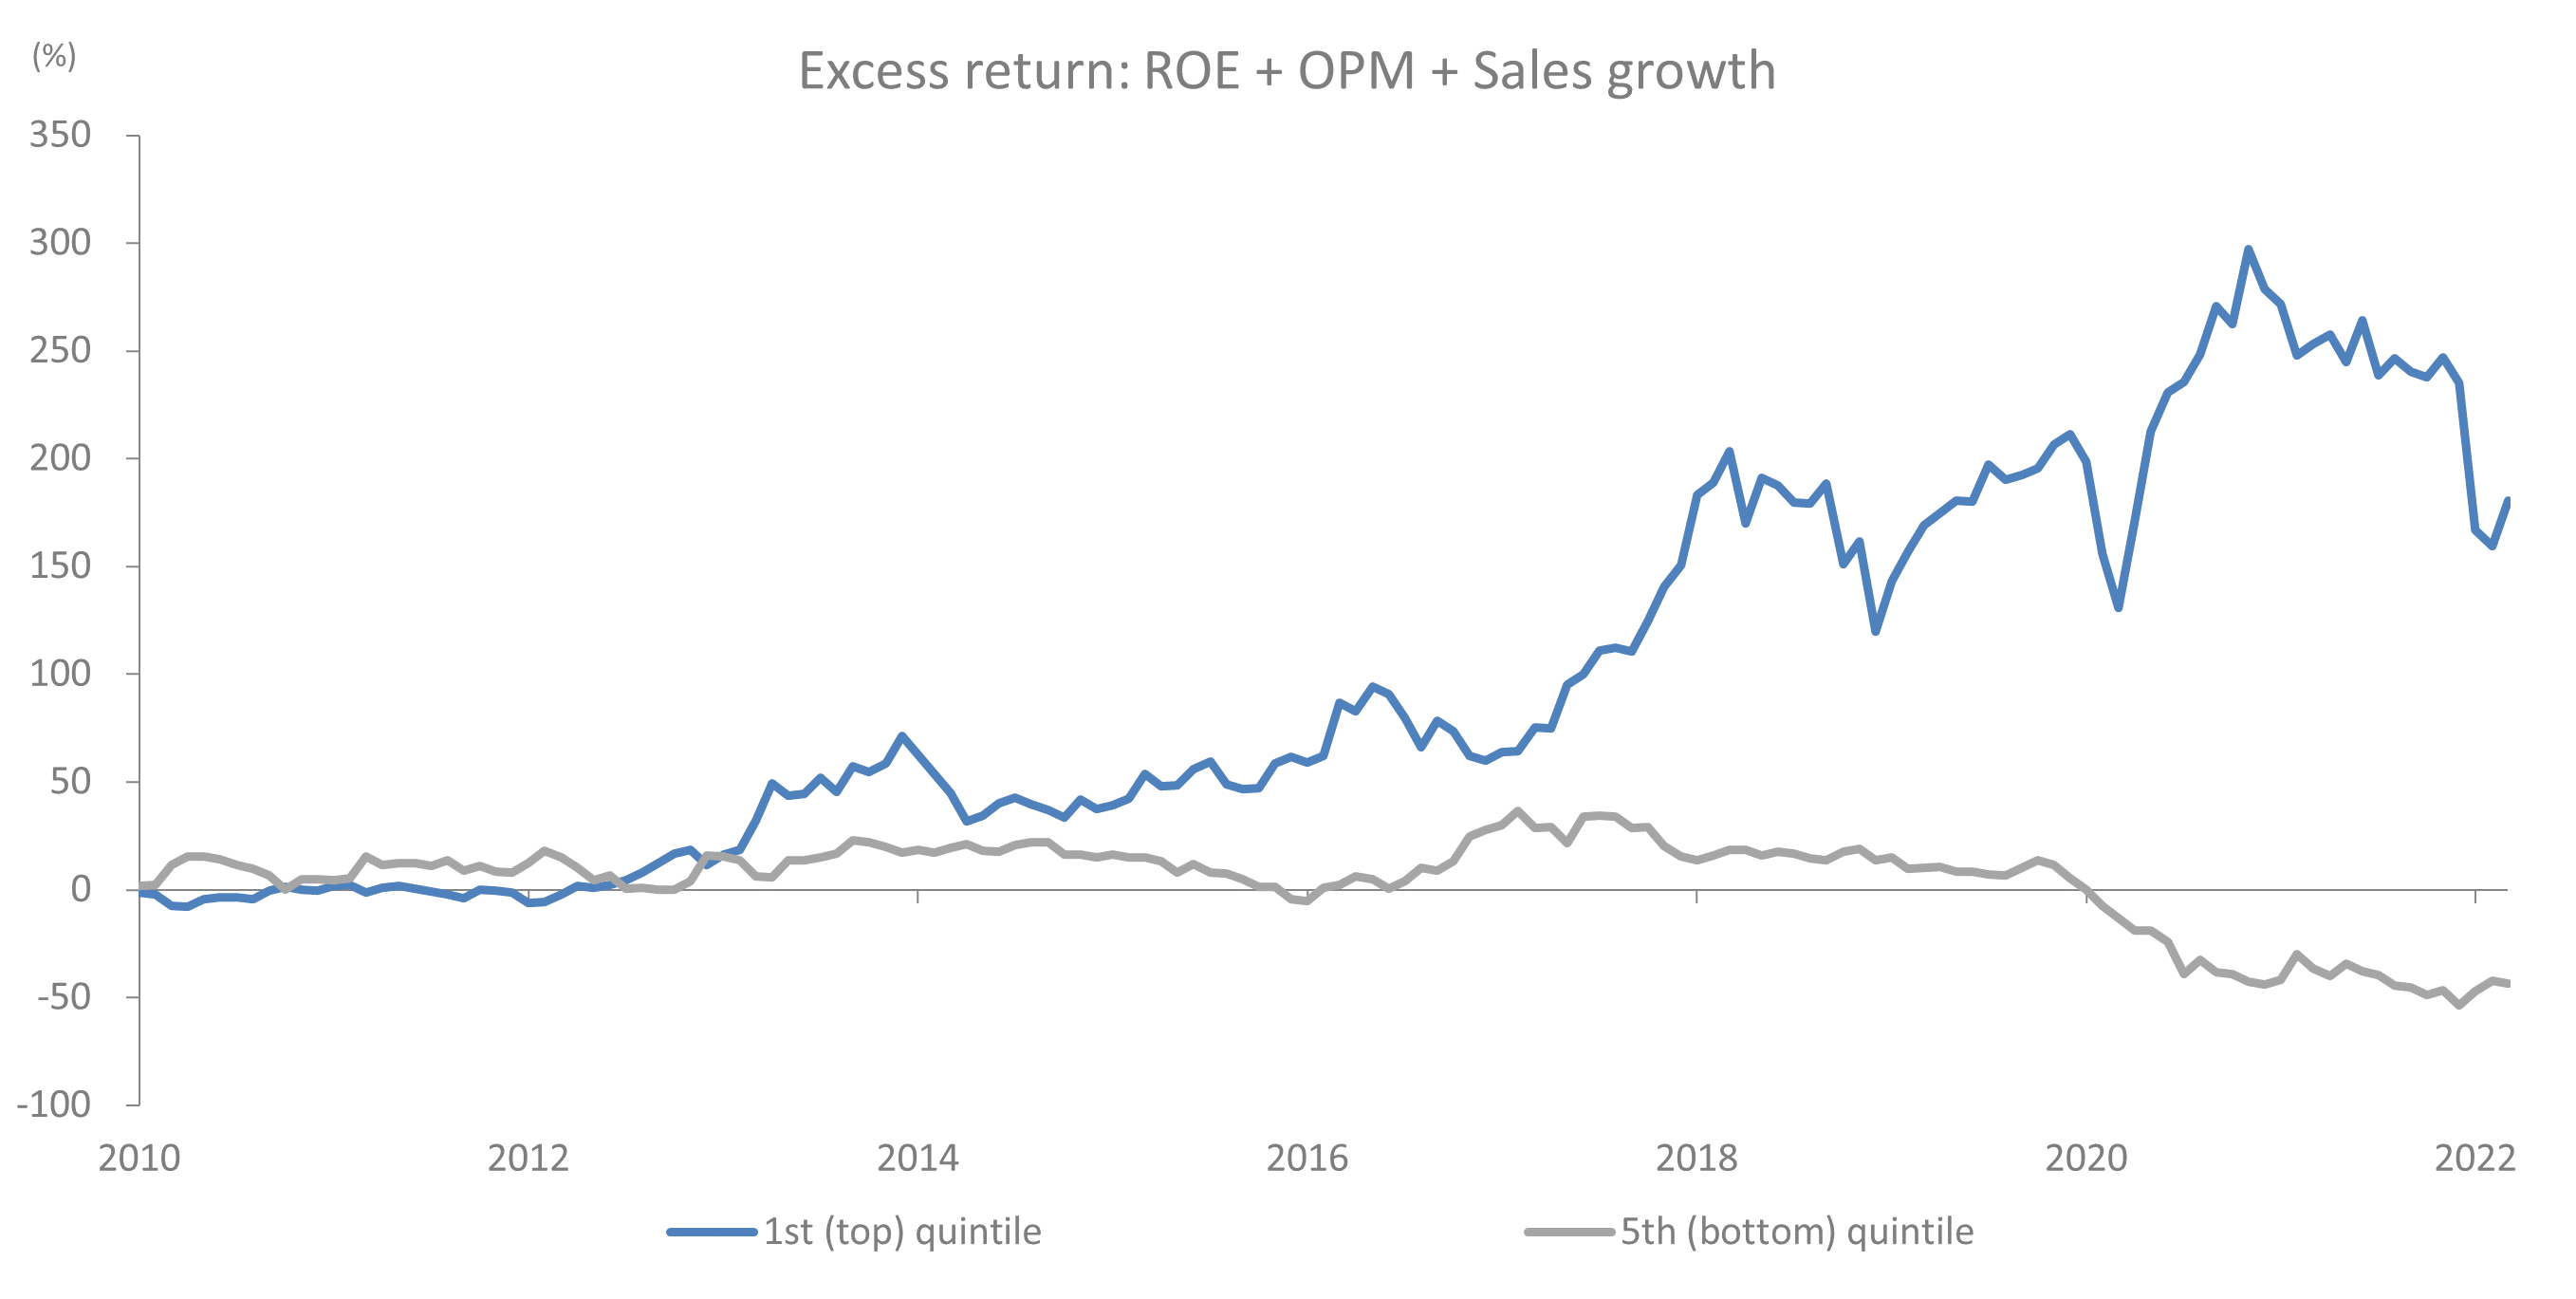
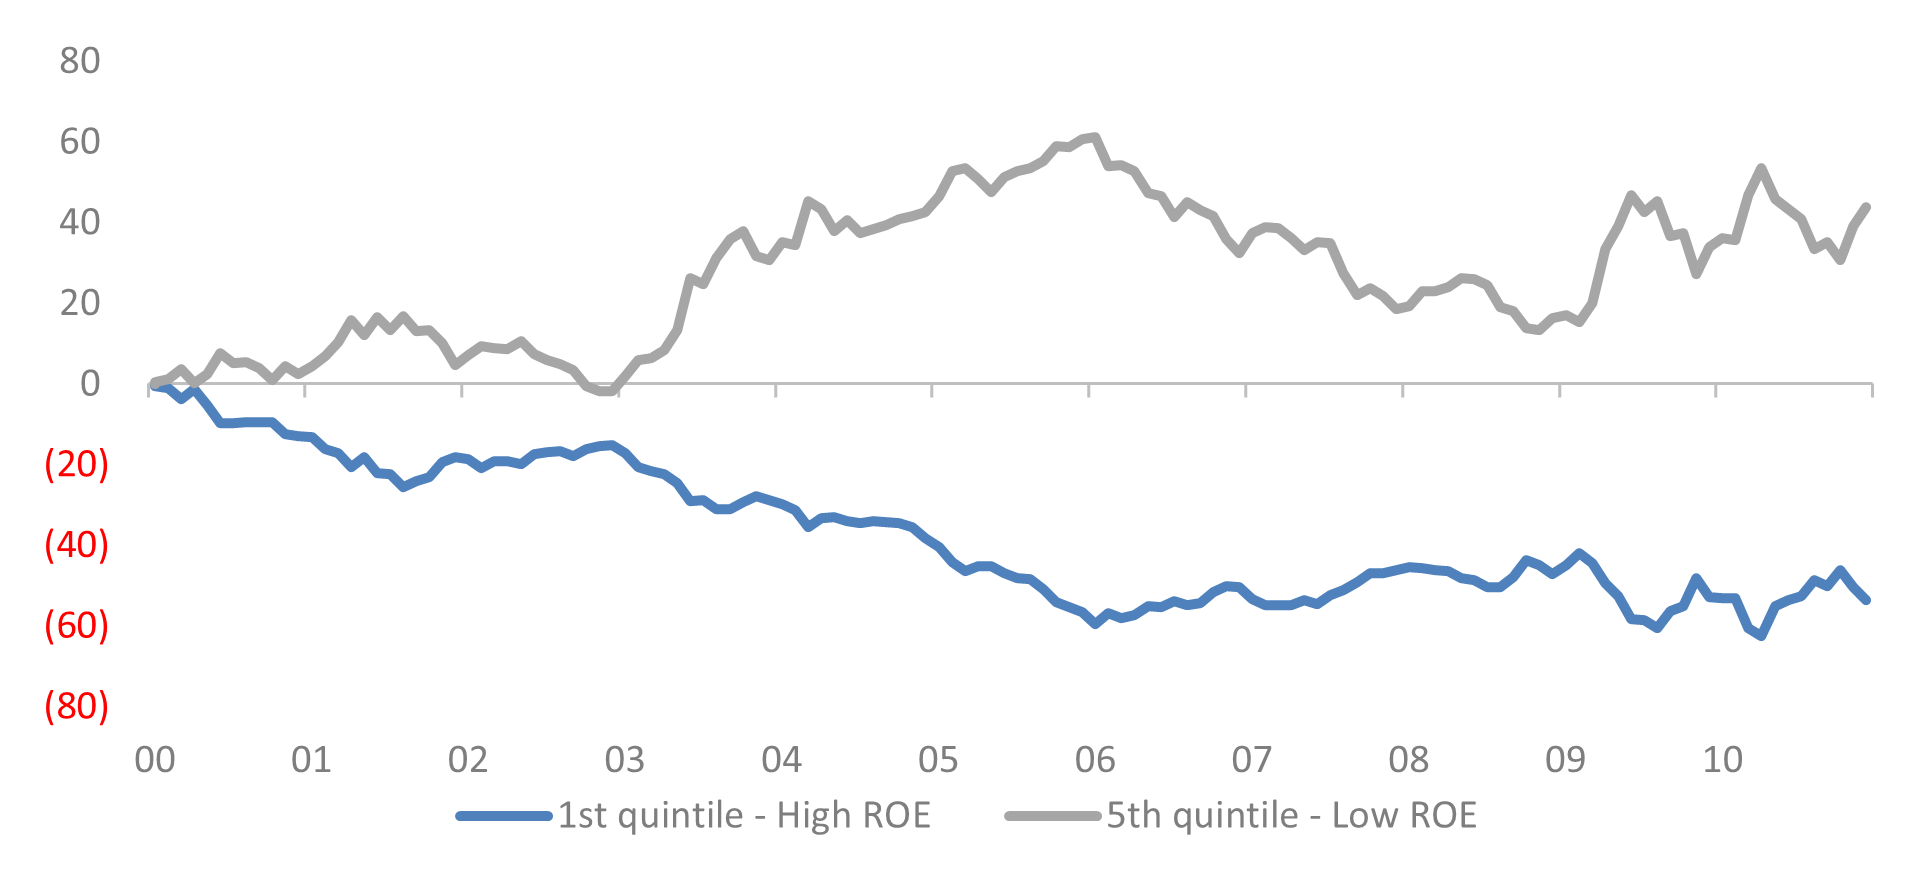
Exhibit 4: Excess return: ROE (2000 – 2010)
Even in a new era, lifetime employment still makes Japan different
Lifetime employment removes one of the primary reasons for public companies to merge. It is also a disincentive for other major corporate restructurings. Perhaps more so for public companies than for private ones, firing people whose functions overlap or are no longer useful has both high financial costs, and high social costs. The Japanese consolidation tendency is a fraction of what you find in the US:
Exhibit 5: # of M&As as % of listed companies
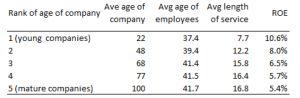
A second outgrowth of the lifetime employment system is that easier to start a new, better company than to fix an old one where the work force only turns over once a generation or so. So it is not surprising that company youth (the number of years since the company was founded) has a close relationship with capital efficiency outcomes:
Exhibit 6: Youth and ROE
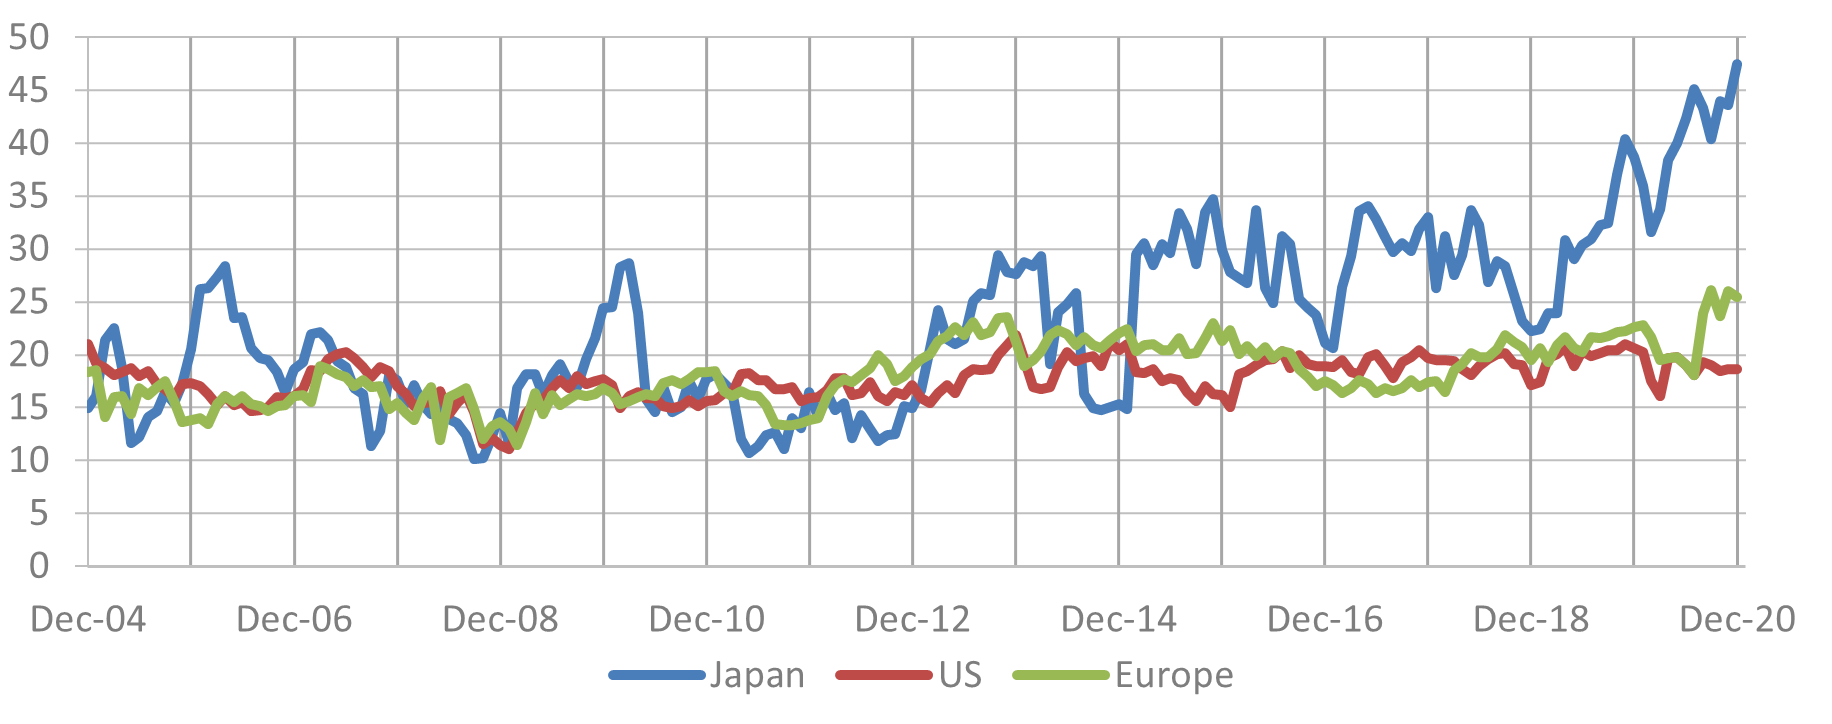
A third result is that, since the Japanese equity market began to “price” capital efficiency early in the last decade, it has priced it with increasing precision. The chart below plots the correlation, over time, between ROE and price/book for companies with ROE over 8%. I have cut out companies with ROE below the Ito report’s targeted 8% because there is essentially no correlation between ROE and price/book when ROE is below 8%. Above 8%, however, the Japanese market perceives small differences in high ROE to be some combination of 1) stickier, and 2) more valuable. And investors price those small differences relatively carefully. This is very different from what we find in the US or Europe.
Exhibit 7: Correlation between ROE and Price/Book
Conundrum: the best Japanese operators ALSO have the least efficient balance sheets
A potential additional rationale for the high Japanese correlation between ROE and P/B lies in the “quality” factor. Specifically, high ROE Japanese companies tend to have much stronger balance sheets than their counterparts in other developed markets, and finance their businesses with far more equity, much of which is often in cash.
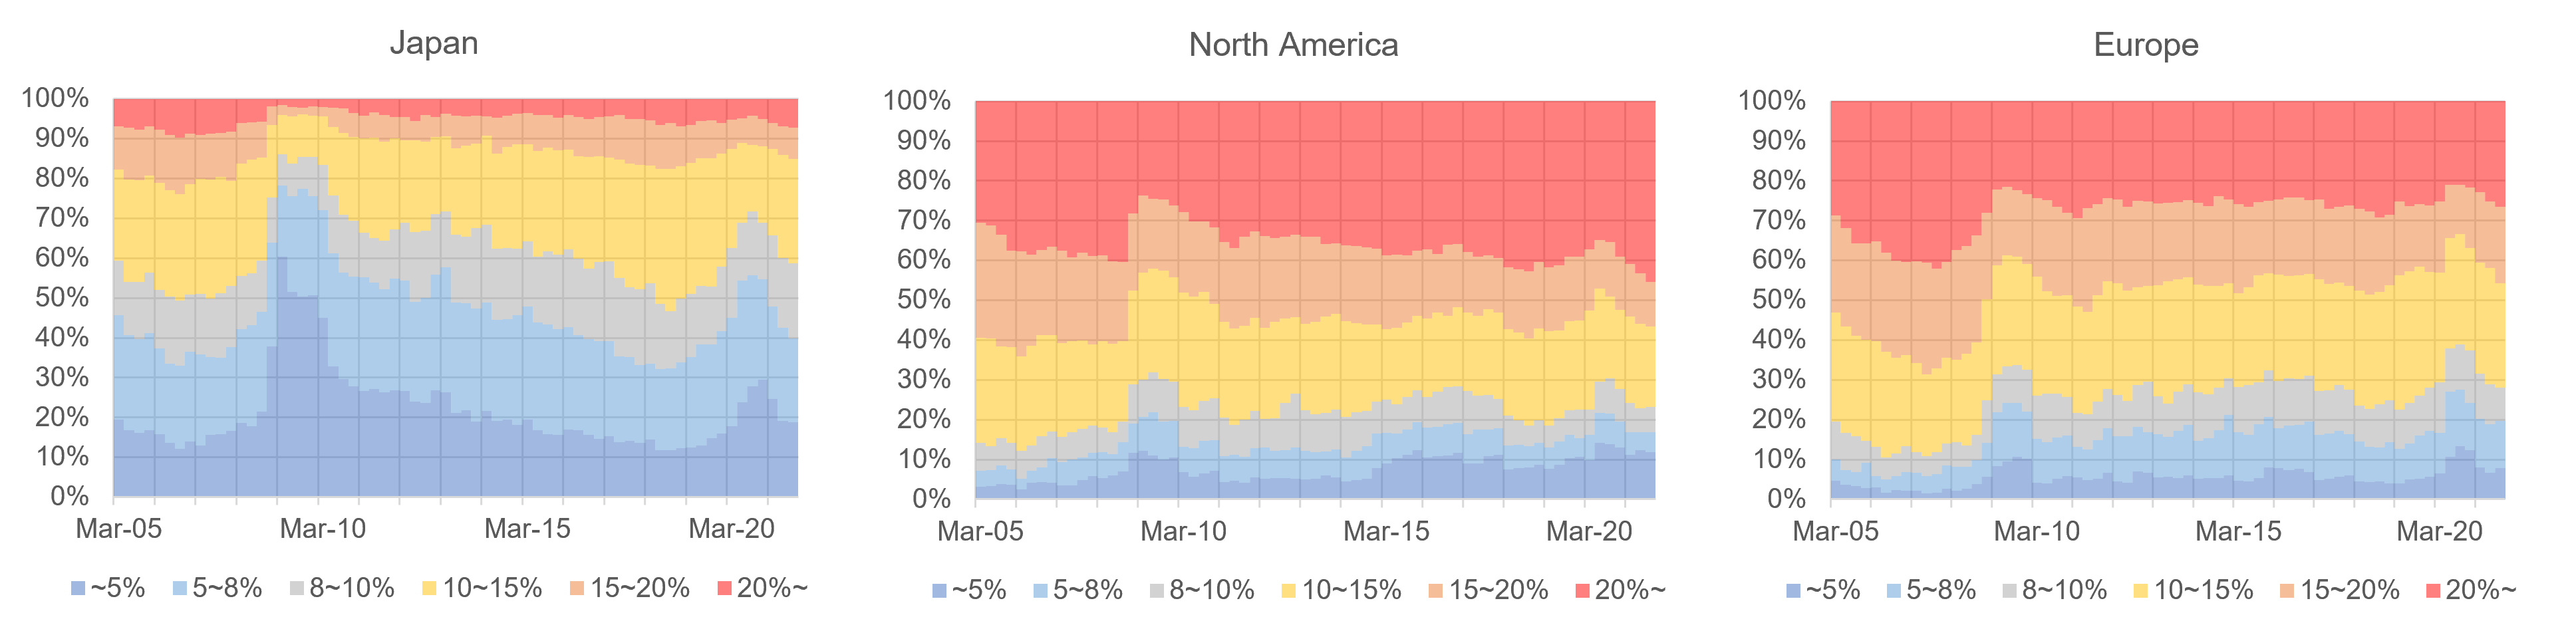
Here is the ROE breakdown for North America, Europe, and Japan. As you might expect, Japan doesn’t look very good:
Exhibit 8: ROE breakdown
Using an ROA breakdown, Japan looks rather better, and similar to Europe:
Exhibit 9: ROA breakdown
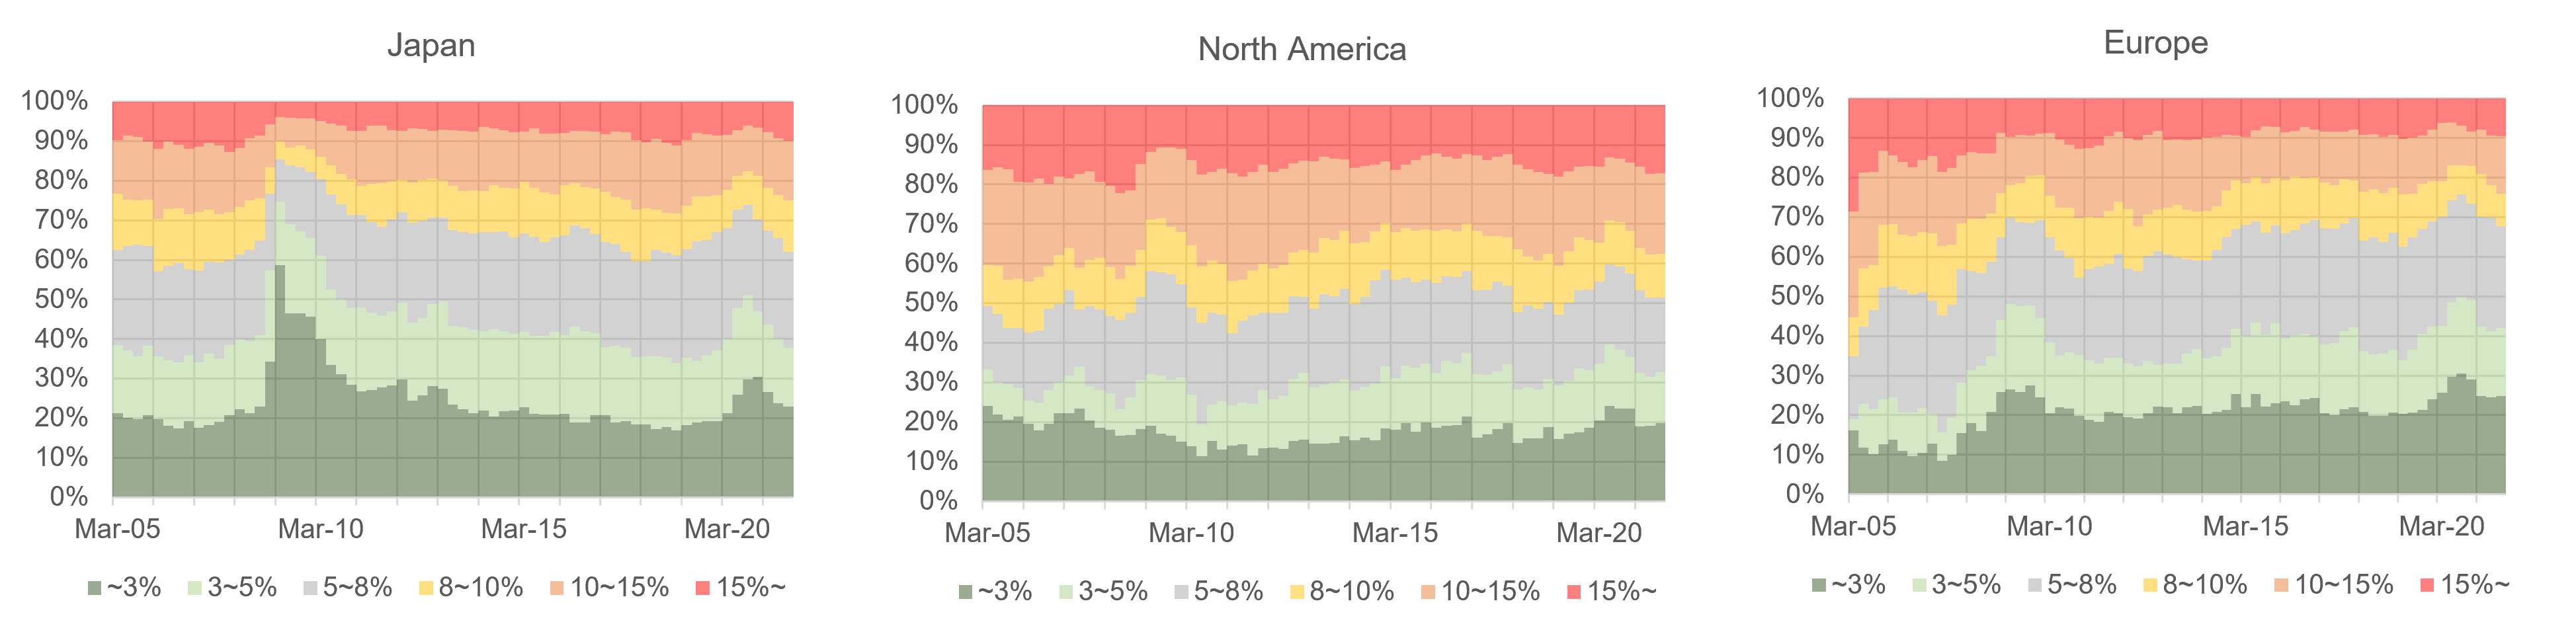
Exhibit 10: Equity ratios of the highest ROA groups
Exhibit 11: Equity ratios of the highest ROE groups
In addition to the corporate cultural inertia driven by lifetime employment, the over-capitalization of Japan’s most asset-efficient companies helps to explain why Japanese investors have come (now that they actually care about ROE) to assume high ROE is sticky, and price it as such. If nothing else, shareholder equity reserves of this scale make it easier to keep ROE at whatever level it happens to be today.
But there is a paradox here, in the simple sense that, on average, the least efficient companies in Japan are inefficient operationally – not because of their capital structure. If the goal is to improve capital efficiency outcomes, there isn’t much low hanging fruit from the perspective of capital structure. For the most part there is only high hanging fruit.
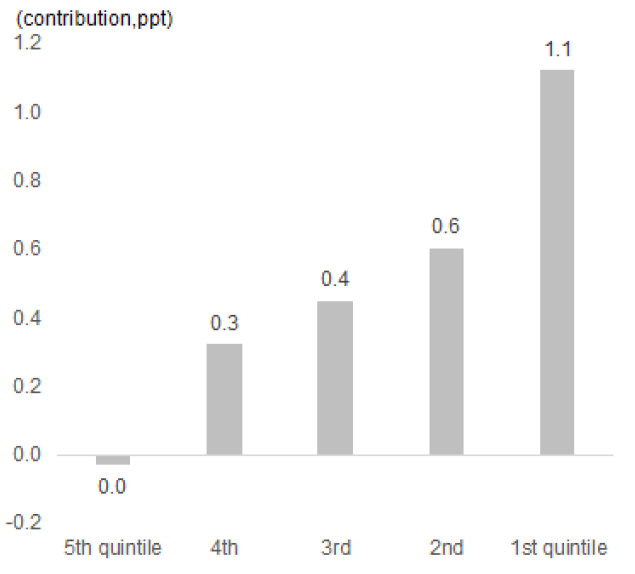
The following chart makes this clear. Of the aggregate ROE improvement from 2010 to 2021, almost half came from the top ROE quintile. Over two thirds came from the top 2 quintiles. Put bluntly, the gap between the good and the not-so-good keeps rising.
Exhibit 12: Contribution to total market ROE improvement by ROE quintile
1) Outside of Japan, the relationship between equity ratio and ROA seems almost incidental, but in Japan one is confronted with the counter-intuitive fact that the companies who produce the most with their assets fund them in the least efficient fashion – at least from the perspective of ROE. Why? Is having an over-capitalized balance sheet, for a specific individual company, a social goal in the same way that high levels of operating profitability might also be?
2) Assuming that you were to try reduce over-capitalization to enhance final ROE outcomes at a total market level, how, exactly, would this best be achieved? Furthermore, how would the possibility that over-capitalization has a social value to the companies concerned frustrate attempts to change the status quo?
The right tail: how the Japanese opportunity set has changed
In this final section I’d like to examine two different ways of looking at the right tail of Japan’s return distribution: 1) the multi-bagger phenomenon, and 2) the population of what I would rather generically call “efficient growth companies.”
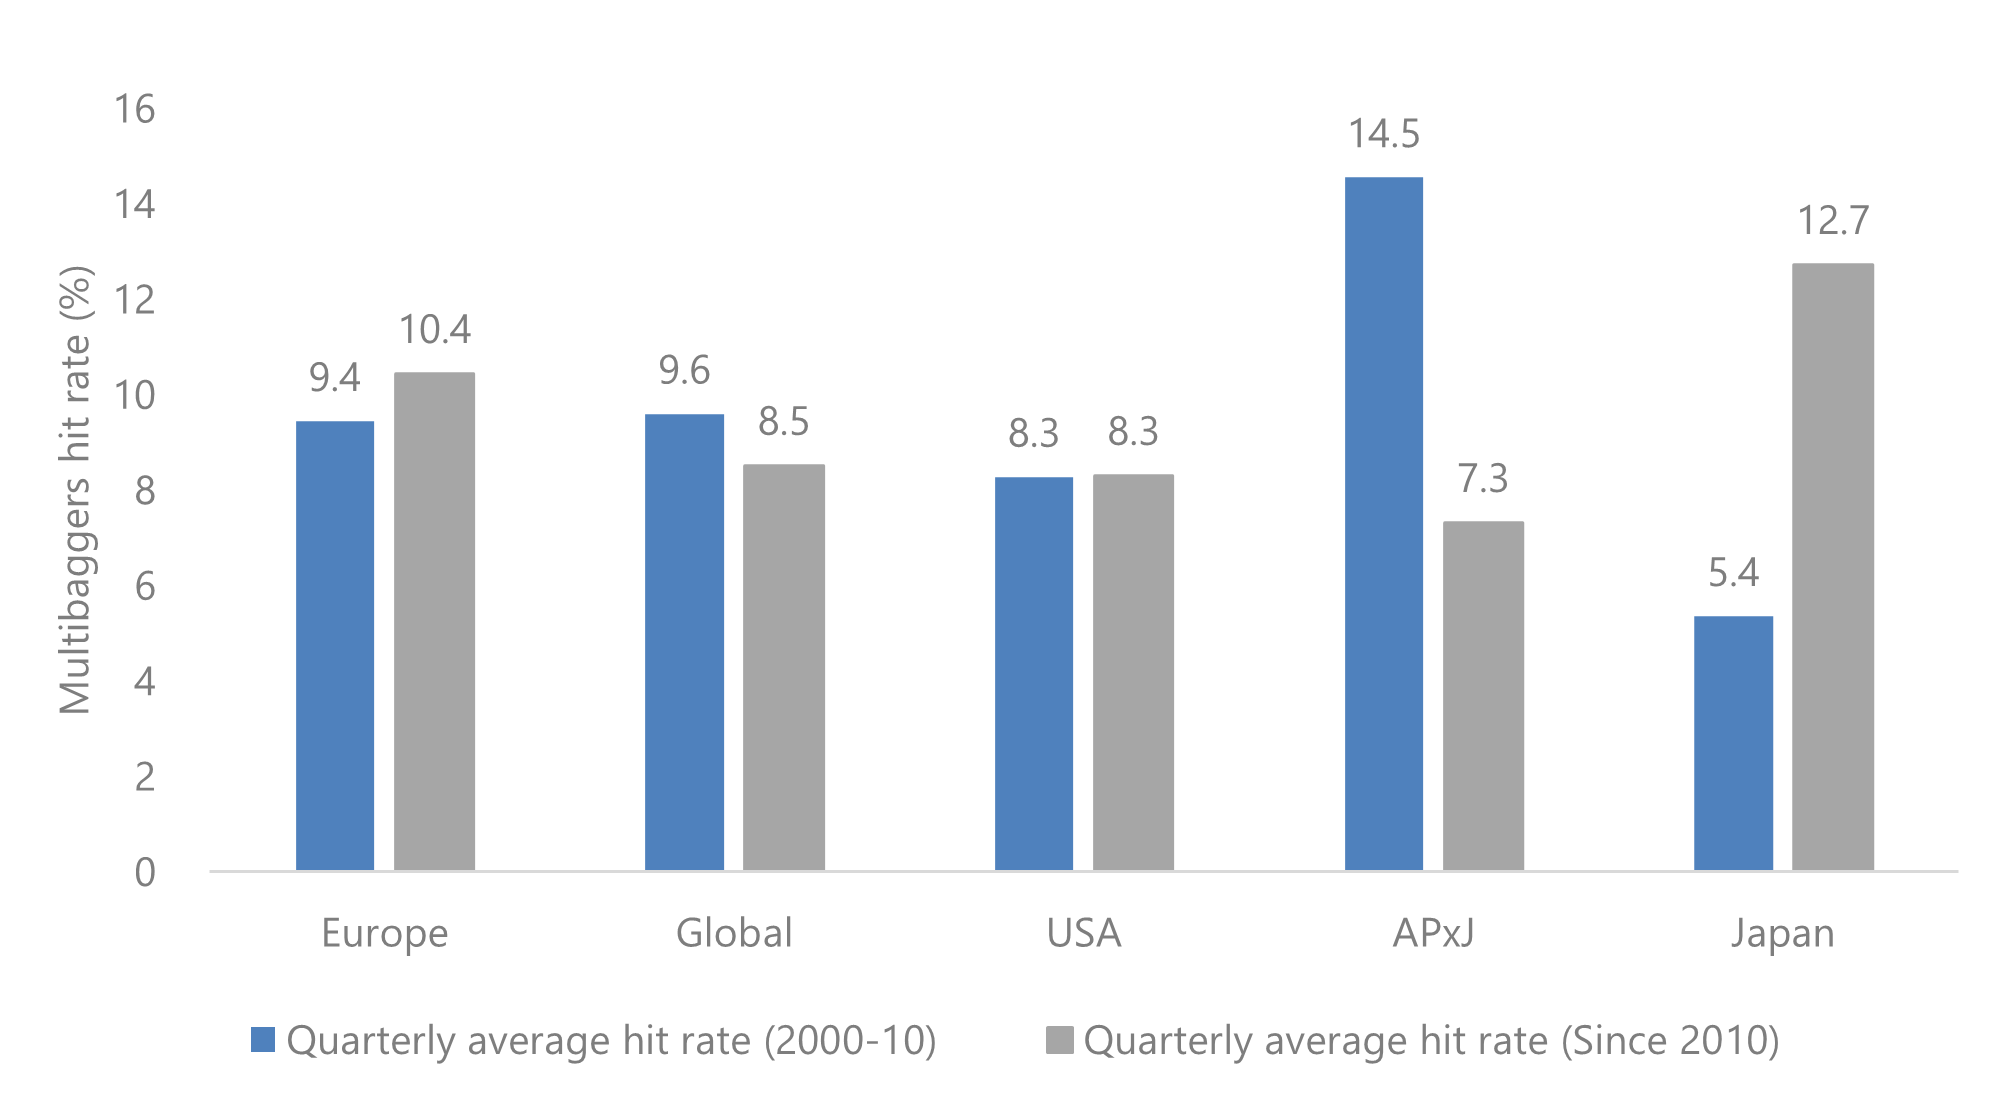
To my knowledge, Shrikant Kale at Jeffries has done the best work on Japanese multi-baggers, which he defines as stocks that have tripled (+200%) while outperforming local market index over the subsequent 5 years.*1 Below is the global comparison chart, with the blue columns representing the period from 2000-2010, and the grey columns representing what came after. In the case of Japan, clearly something changed between the first period and the second.
Exhibit 13: 5-year multi-baggers hit rate (average)
As a result, many analysts have looked at differences in research coverage to help explain this instance of greater Japanese market inefficiency.
Exhibit 14: US vs Japan: Percentage of companies with Exhibit 15: US vs Japan: Percentage of companies with
analyst coverage less than three analyst coverage less than 3 broken down by market cap
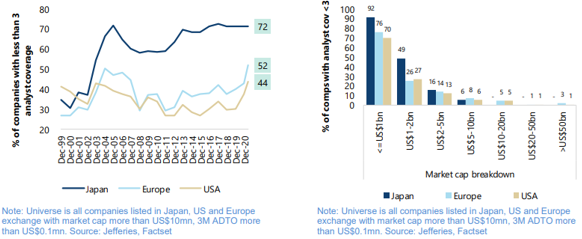
Japanese stocks are indeed less well-covered than those in other developed markets. This applies particularly to the $1-2bn market cap space, where the minimal Japanese consolidation tendency most crucially reduces investment banking fees and, as a result, sell-side analyst coverage. However, the analyst coverage gap was also in place for most of the time that Japan produced a very low rate of multi-baggers and is therefore, like the improvement in index returns, incapable of fully explaining what’s happened in Japan in the last 10+ years. Both may be necessary contributors to the high rate of Japanese multi-baggers in the last decade, but neither alone is sufficient.
With those caveats, what the multi-bagger data do show, like the ROE return charts above, is that the period from 2010-2020 was quite different from the previous decade.
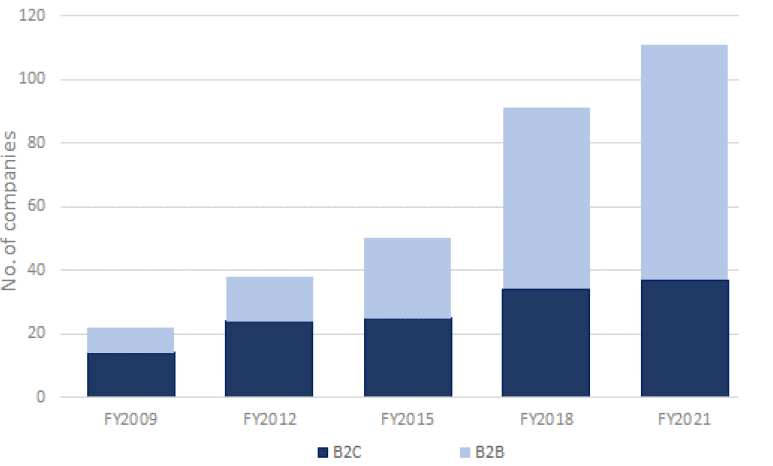
Another key way the Japanese opportunity set has changed is that there is an increasing number of growing, profitable companies listed in Japan. The fastest growth has been in the B2B sector.
Three years ago, based on FY18 (March 2019 for most companies), I put together the following chart, which shows the number of companies with ROE of at least 15%, OPM of at least 10%, and sales growth of at least 5% (the FY21 – March 2022 – numbers are based on Bloomberg consensus). I looked several different cutoffs and generated a similar trend line, so I just reverted to the type of financial outcomes which might make me interested in further researching a particular Japanese equity, and still produced a reasonable population at the end of the time line. I also used a market cap cutoff of $500m. Here is the updated chart, with the names divided between B2B and B2C:
Exhibit 16: Number of efficient growth companies
The demographic information is just as telling as the overall trend. This is what the companies above actually do:
Exhibit 17: Number of efficient growth companies by industry
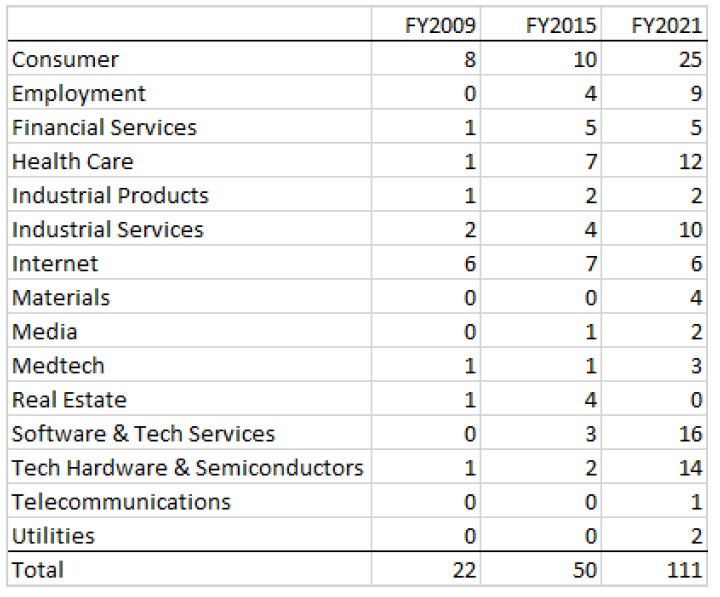
One of the first things you will notice is that, outside of tech hardware and semiconductors (most of both groups are SPE names), there aren’t very many manufacturers on the 2021 list. That’s because many of the Japanese companies that make the best “stuff” aren’t actually particularly good companies from a purely financial perspective. SPE is really the only manufacturing sector with any substantial representation in this list.
I have three other observations on these numbers:
1) The population share of the consumer sector is the largest of any one group, but its market share has slipped since 2009 – particularly if you include the internet sector, most of which is also B2C. The increase in B2B names overall has been considerably faster than the increase in B2C. This makes sense in the context of a) increasing public and private pressure for higher return outcomes, b) the impracticality of rapid adjustments in the labor force, which is also one of c) the numerous disincentives to consolidate. Faced with this combination of factors, companies have, not surprisingly, outsourced.
2) Software and tech services have the second-largest weighting in the 2021 group. This might be roughly as expected, but before I put the data together I would not have suspected that there would be zero software names in 2009.
3) Many readers unfamiliar with Japan might reasonably wonder why roughly 1/10th of its statistically strongest companies would be in the employment services business. The scale of Japan’s non-permanent employee economy, which accounts for over 1/3 of the labor pool, provides crucial context. Here is the table from the Ministry of Health, Labour, and Welfare (the 5-yr increments in the early data correspond to the increments on the Ministry’s website). *2
Exhibit 18: Japan labor pool
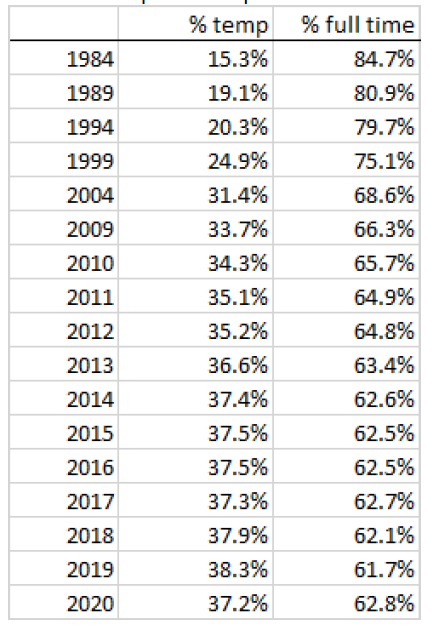
For reasons which are not entirely clear, early in the second Abe administration (i.e., around 2015) Japan seems to have settled on a roughly 38% ratio for employment outsourcing. Assuming that ratio means something, the data lead one to further assume that continued pressure for return has created additional opportunities for other types of outsourcing, particularly in the software and industrial services areas.
CONCLUSION
There is a tendency among many thoughtful observers of Japan, particularly in the press, to assume greater resistance to the pro-shareholder policy changes enacted over the last decade than actually exists. This assumption is called into question by the price formation data presented above, which shows that there has been a bottom-up change unfolding at the same time as the top-down adjustments to the regulatory regime. I believe that the bottom-up transformation is a large part of the reason that the top-down directives were, for the most part, accepted with little opposition. And also why the changes in the regulatory regime have, for the most part, done what they were designed to do – even if there remains a healthy debate about whether they were sufficient or “successful.”
Given Japan’s demographic challenges, and assuming that a decline in living standards is politically unacceptable, Japanese society seems to have decided that it has little choice but to co-exist in some fashion with equity capitalism, and the results of that decision are logically reflected in policy, in price formation, and in the rising population of relatively capital efficient, growing companies.
The structure of the Japanese employment market is the probable root cause of many peculiarities examined above, from the anemic consolidation tendency to the dispensation to outsource shown in my penultimate data set. Now that part-time employment “subsidizes” the permanent system with over 1/3 of the labor force, it seems to me that the foundation is in place for a long term two-tiered system. That said, the lifetime employment system is socially and politically defended while remaining, economically, under threat.
It remains to be seen if PM Kishida will put into practice any of his thoughts on corporate cash reserves. While it must be acknowledged that the best corporate asset managers in Japan are also the most inefficiently funded, their status in Japan’s social and corporate elite will present challenges to any disruptive policy. My belief is that changes to the over-capitalization of Japan’s best companies are more likely to come from the bottom-up than the top-down. As Exhibit 12 shows, Japan’s most efficient companies are already contributing more than their fair share to the nation’s aggregate ROE improvement.
In the meantime, the ongoing demographic pressure for higher return should continue to create – with a number of Japanese peculiarities – an increasingly diverse set of bottom-up opportunities. Here is where I think that is most likely to come from:
1) The gap between the most profitable companies and everyone else will continue to increase. Incremental ROE so far has mostly come from ongoing operational improvements within the cohort of Japan’s strongest companies. Should this cohort subsequently seek to improve the efficiency of its capital structure – which it clearly hasn’t done yet – the potential for further financial outperformance is considerable.
2) Due in large part to the scale of cultural inertia in Japanese companies, activist investors in Japan will probably find greater success targeting capital structure than operational inefficiency. Which in turn will lead them to companies closer to the top of the ROE list than the bottom.
3) Outsourcing. In a labor market which is roughly 62% frozen, the need for and the value of business process outsourcing (BPO) should be greater than in a fully liberalized labor market. As Japan’s aging population increases the financial pressure on all Japanese companies, the need for and value of BPO should continue to grow, as we already see happening in Exhibit 18.
*1 companies with market cap and ADTO more than US$50mn and US$0.5mn at the start
*2 There is a significant lag between in the growth of the temporary labor pool and the emergence of larger, profitable providers. This emergence stems in part from an on-going market share shift to the larger players, many of which, like Recruit (which owns Indeed) are now effectively on-line. Some of that shift, in turn, has been driven by tighter regulation.
A PDF version of this report can be downloaded here.
David Snoddy
CEO, Nezu Asia
https://www.nezuasia.com/