I recently gave a presentation in which I tried to answer this question. Here are the top-line conclusions:
- Investors are finding their voting voices
- Now they need to find to find their asking voices
- There is a way to tear down the “allegiant shareholder ” wall
- Factors that correlate with superior performance include: >= independent directors, low “allegiant” holdings, >15% female directors, and age of firm <45 years
- Activism is becoming more effective
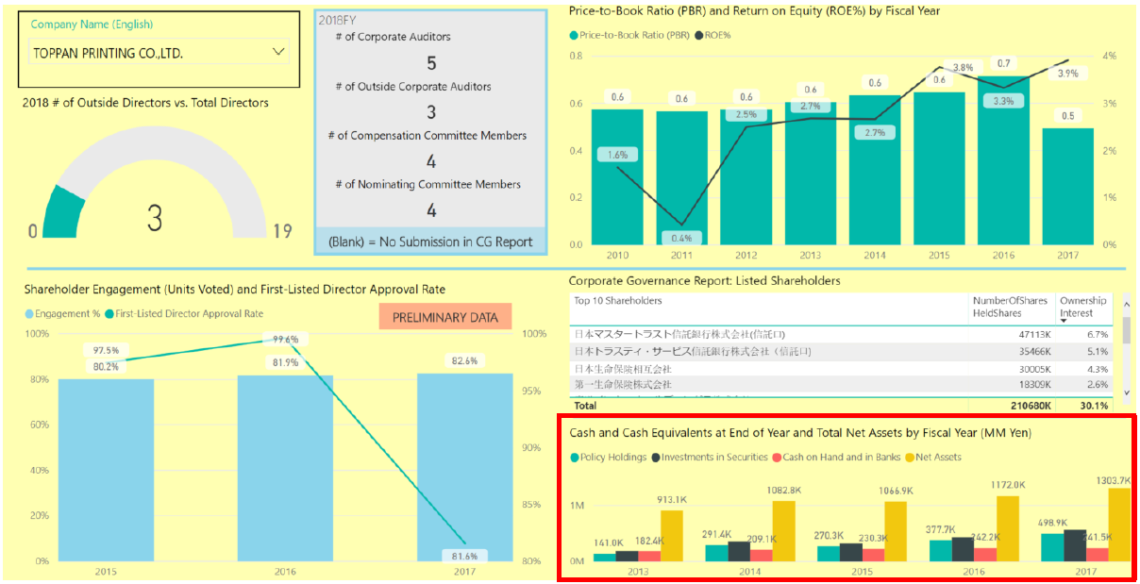
These conclusions are based on a huge amount of time-series data we have collected. We are now building a comprehensive time-series database that includes not only financial data, but all text and numerical data from financial reports and CG Reports, as well as tabulated AGM voting results for each resolution. The data will be organized so that one can zero in on exactly the data one needs. Here is a simple example showing board practices parameters, historical AGM participation and CEO approval rates, and the trend of ownership of “allegiant shareholdings”:
Using this database, we will soon be able to conduct any time-series statistical analysis we like.
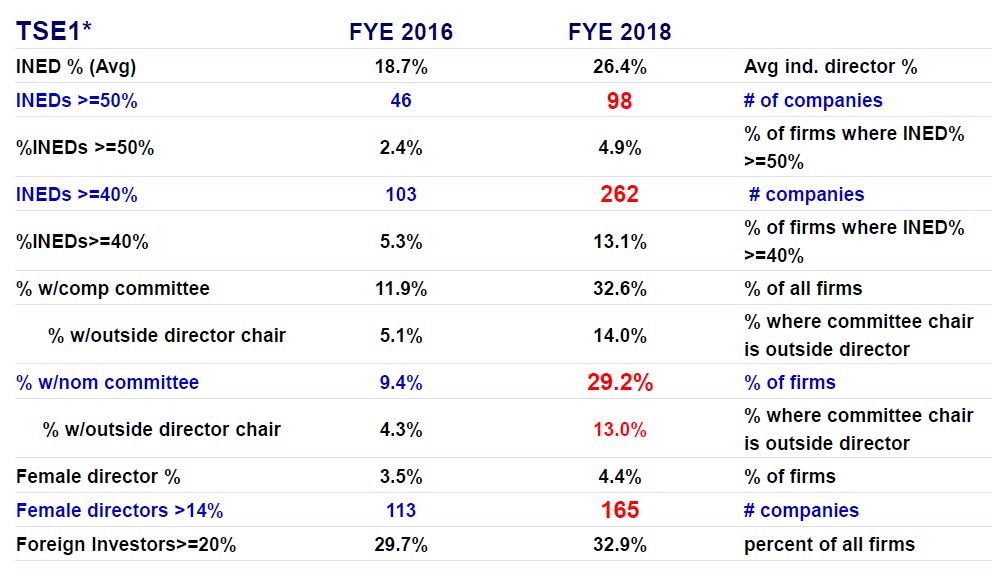
For example, our preliminary analysis so far shows that compared to FYE2016, as of FYE2018, 98 firms in TSE1 (non-financials, excluding two extreme outliers) had >=50% independent directors, up from 46 such firms… and that these companies tend to have:
- higher valuations (PBR or Tobin’s Q)
- higher ROA, ROIC, ROE, and FCF,
- far fewer “policy stockholdings” (allegiant holdings),
- higher CEO re-election approval rates, and
- more independent committees and female director
They also tend to build up cash a bit faster than they can pay it out or reinvest it.
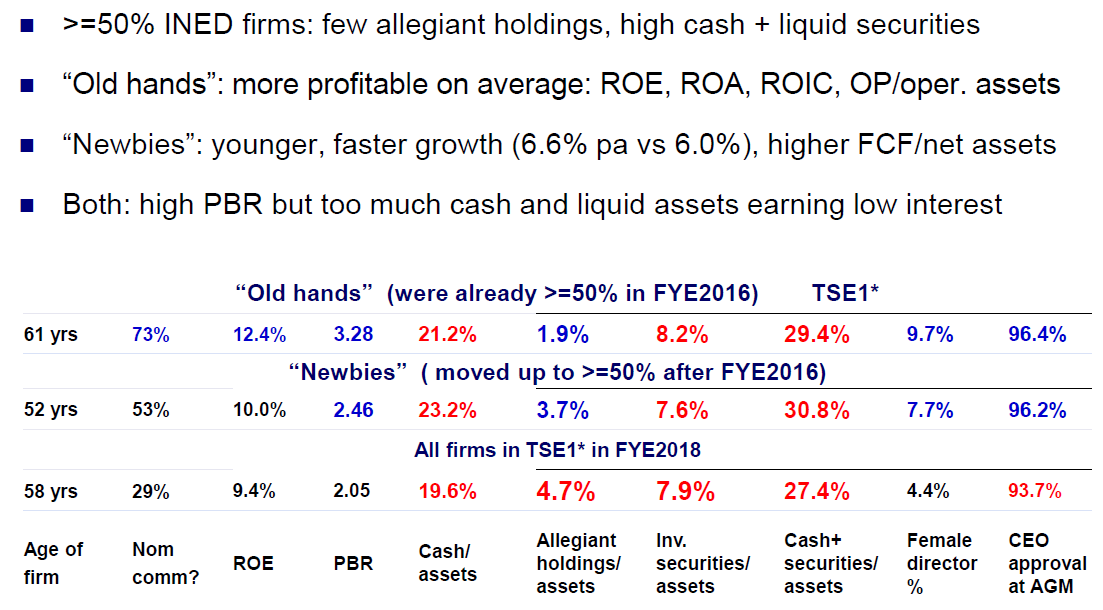
If we compare the companies that already had at least 50% independent directors as of FYE2016 (the “old hands”) with the 52 “newbies” who only recently joined this group, both groups out-perform the TSE1 non-financials on average. We also see the following differences between the two groups and the (overall) TSE1 non-financials group:
To an increasing number of executives, the writing is on the wall: over the medium-term, the market is moving towards >= 50% INEDs, and towards using them in committees:
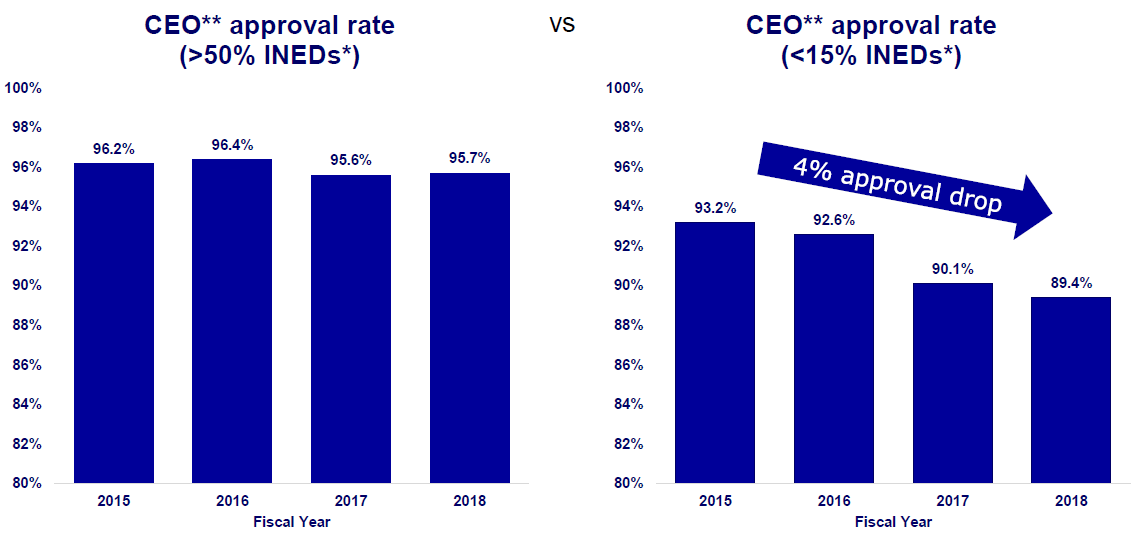
This is not so surprising when one considers the fact that companies with few INEDs are receiving lower and lower CEO approval rates at AGMs over time: Nicho
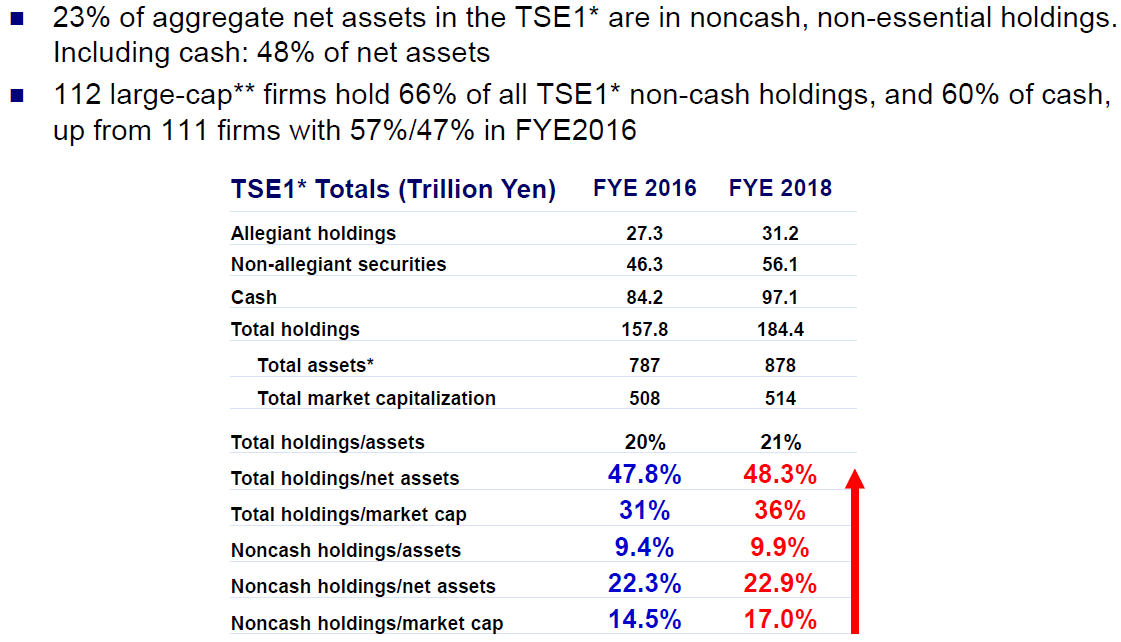
Other interesting conclusions we have reached include: (a) a low proportion of total assets that are locked up in “allegiant” holdings (cross-shareholdings and other “policy stocks) clearly correlates with superior performance; however, (b) the aggregate amount of such “allegiant shareholdings” in the entire market (non-financials only) is not decreasing. Over the past few years, it has actually increased a bit. Many of these holdings are concentrated among a relatively small group of large, “older-age” companies established more than 45 years ago. For example:
The full presentation materials can be downloaded here.
Nicholas Benes
