In this article, I would like to try to summarize the recent analysis in this paper.
Metrical Analysis
We began analyzing corporate governance of Japanese companies in full swing in June 2015, covering 500 companies at that time. Since then, from February 2018 to the present, I have analyzed approximately 1,800 companies. These 1,800 companies are used as the universe and are updated monthly based on publicly available information such as annual securities reports, corporate governance reports, and financial statements. Metrical’s corporate governance analysis is divided into Board Practices and Key Actions. This is because even if the board structure and other board practices are formally in place, it is skeptical that they are being used to manage the company to create value. This is based on the hypothesis that, ideally, improvements in corporate governance will lead directly to value creation, or that improvements in board practices will create value through key actions such as cash allocation, share repurchases/reirements, etc. Therefore, I believe that key actions should be added to corporate governance evaluations.
Percentage of Foreign Share Ownership
This approach is similar to the investors’ approach to engagement with their portfolio companies. Through engagement, overseas investors have engaged in dialogue to seek improvements in board practices as well as key actions to achieve the management goal of sustainable growth in corporate value. This approach is similar to the investors’ approach to engagement with their portfolio companies. Through engagement, overseas investors have engaged in dialogue to seek improvements in board practices as well as key actions to achieve the management goal of sustainable growth in corporate value. The results of this effort are beginning to show in improvements in profitability, board practices, and key actions.
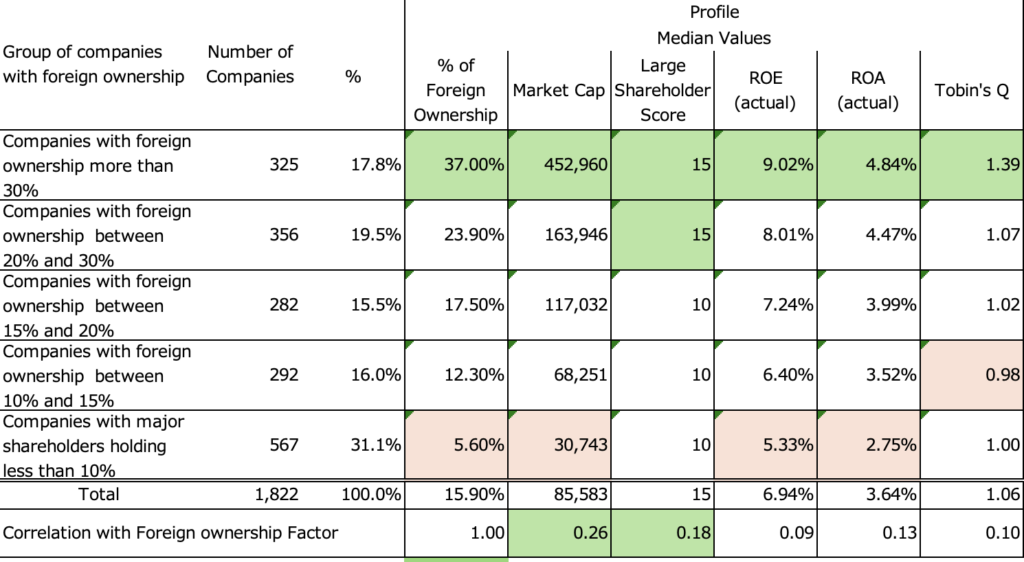
The Metrical universe of 1,822 companies (as of January 2024) was divided into five groups (more than 30%, more than 20% and less than 30%, more than 15% and less than 20%, more than 10% and less than 15%, and less than 10%) by foreign shareholding ratio and analyzed for each category as shown below. The median foreign shareholding ratio is 15%, but according to TSE data, the shareholding ratio of overseas investors is more than 30%. This indicates that large-cap stocks, which are the investment targets of overseas investors, tend to have high foreign shareholding ratios. In addition, based on my past analysis, I believe that there is a threshold for the 30% foreign ownership ratio, and it can be expected that the influence of foreign shareholders will become stronger, and as a result, the company’s management will be improved. I assume that the presence of 1/3 of special resolutions at the shareholders’ meeting has an impact on this.
Companies with high foreign shareholdings are characterized by large market capitalization and high profitability, as shown in the table below. This results in higher stock price valuations. Another characteristic is a tendency to avoid investing in listed subsidiaries of the parent-subsidiary listings.
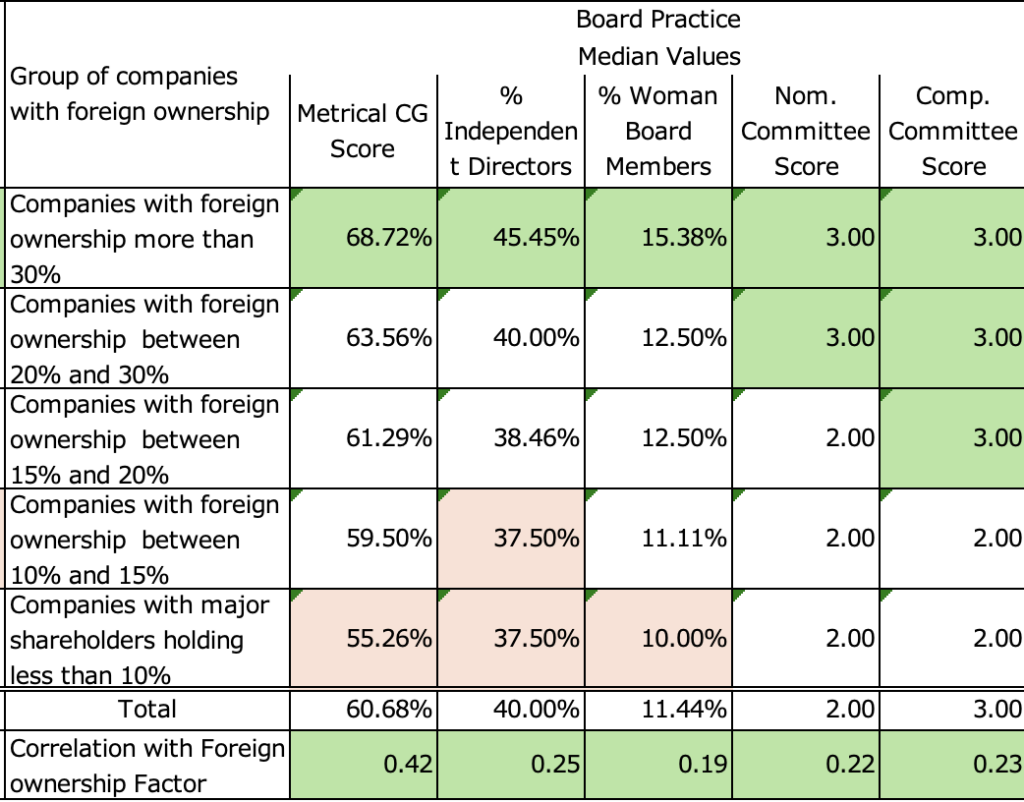
Next, the characteristics of board practices for companies with high foreign shareholding ratios are markedly superior for companies with foreign shareholding ratios of 30% or more. Since companies with foreign shareholdings between 20% and 30% also generally show superior values, it seems reasonable to assume that board practices improve as the foreign shareholding ratio increases and the influence of overseas investors increases. Engagement of overseas investors has likely contributed to the improvement in board practices.
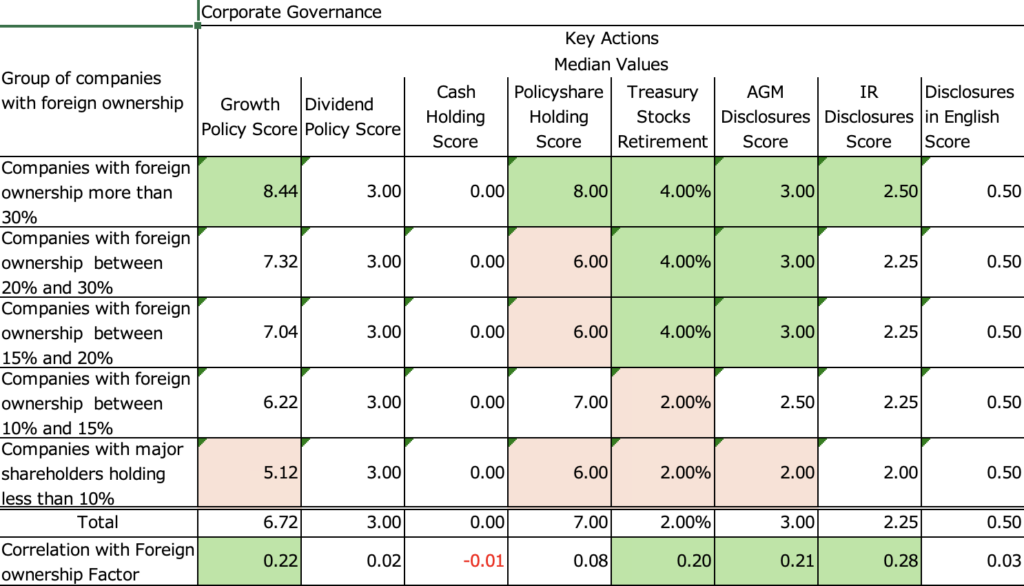
Key actions for companies with high foreign shareholdings are shown in the table below, Companies with 30% or more foreign ownership have superior values in the Growth Policy Score, Policieshare Holding Score, Treasury Stocks Retirement, AGM Disclosures Score, and IR Disclosures Score. On the other hand, the Cash Holding Score shows challenges in all groups, suggesting that many companies have excess cash on hand, and all companies have challenges in cash allocation. Companies need to use more cash for investments and shareholder returns.
Valuation trends over the past year
One year has passed since the TSE requested a P/B increase at the end of March 2023. Valuations are expected to increase as many companies’ stock prices have also increased. The following analysis examines the trend of companies that have increased their Tobin’s Q in the Metrical universe for the period March 2023 to March 2024.
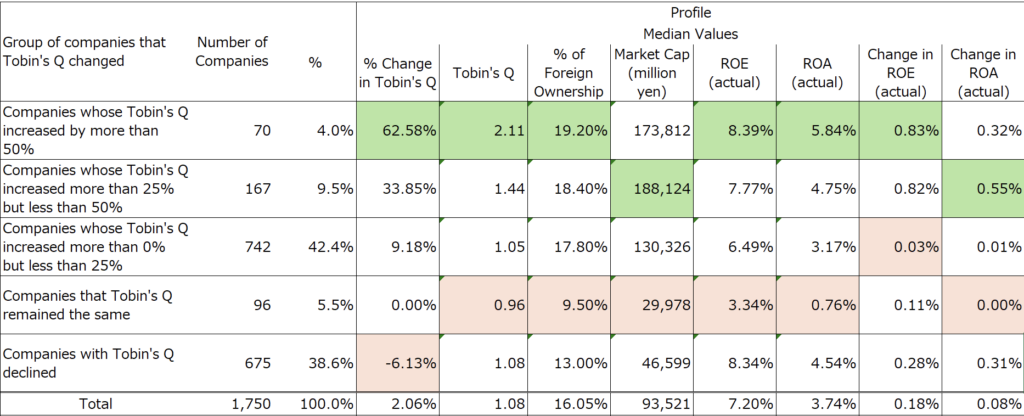
In the 1,750 comparable Metrical universe companies from March 2023 to March 2024, the analysis is divided into 5 groups (>50% increase, >25% to <50% increase, >0% to <25% increase, no change, and decrease) for each item in terms of percentage change in Tobin’s Q. The median percent change in Tobin’s Q during this period was 2.06%.
It is clear that companies whose Tobin’s Q increased by more than 50% include companies with high Tobin’s Q, average ROE and ROA over the past three years, and foreign shareholding ratios. Again, this confirms that the drivers of rising valuations are overseas investors. Tobin’s Q increased for companies with relatively large market capitalizations, which are the target of overseas investors. Another notable finding is that companies with Tobin’s Q increases of more than 50% and more than 25% but less than 50% have continuously increased their ROE and ROA.
In contrast, companies whose Tobin’s Q did not change traditionally have lower Tobin’s Q, lower foreign shareholdings, smaller market capitalization, and lower ROE and ROA. On the other hand, the case of companies whose Tobin’s Q has decreased is somewhat more complicated. While a more detailed analysis is needed, these companies tend to have lower foreign shareholdings and smaller market capitalizations, but they may also include companies that have adjusted for excessive valuations, as their Tobin’s Q is relatively high. These companies have increased ROE and ROA, which may include companies with lower valuations and increased investment attractiveness if profitability is not an issue.
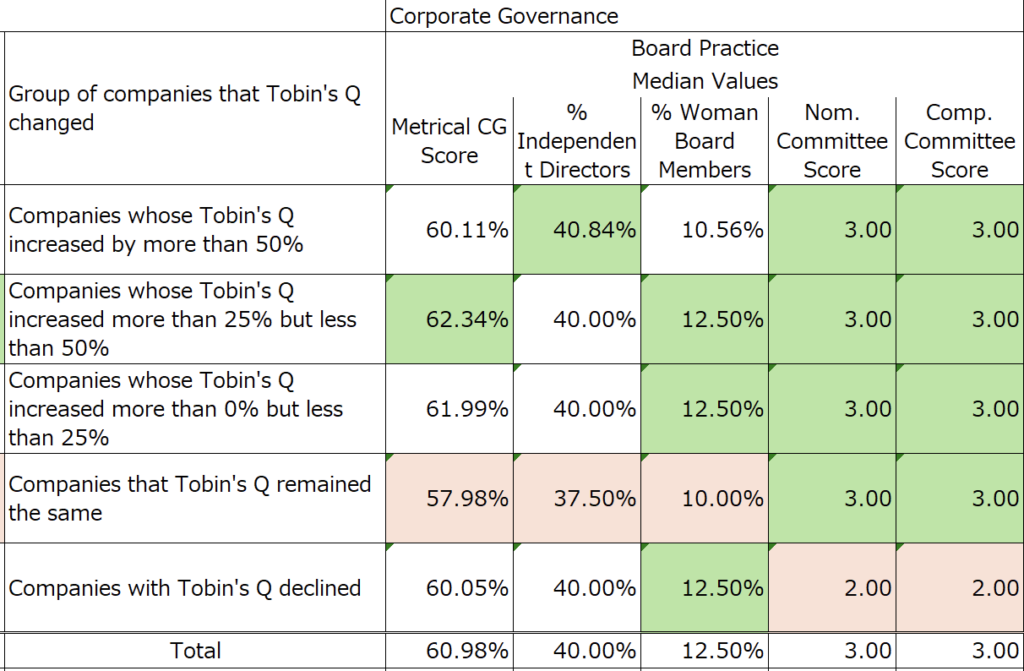
As for the percentage change in Tobin’s Q and the characteristics of board practices, there are no outstanding characteristics as shown in the table below. However, the companies with the highest foreign shareholdings, those whose Tobin’s Q increased by more than 25% but less than 50%, have the best values for board practices and Metrical CG Score. This indicates that foreign shareholdings are a driver of board practices, as noted above.
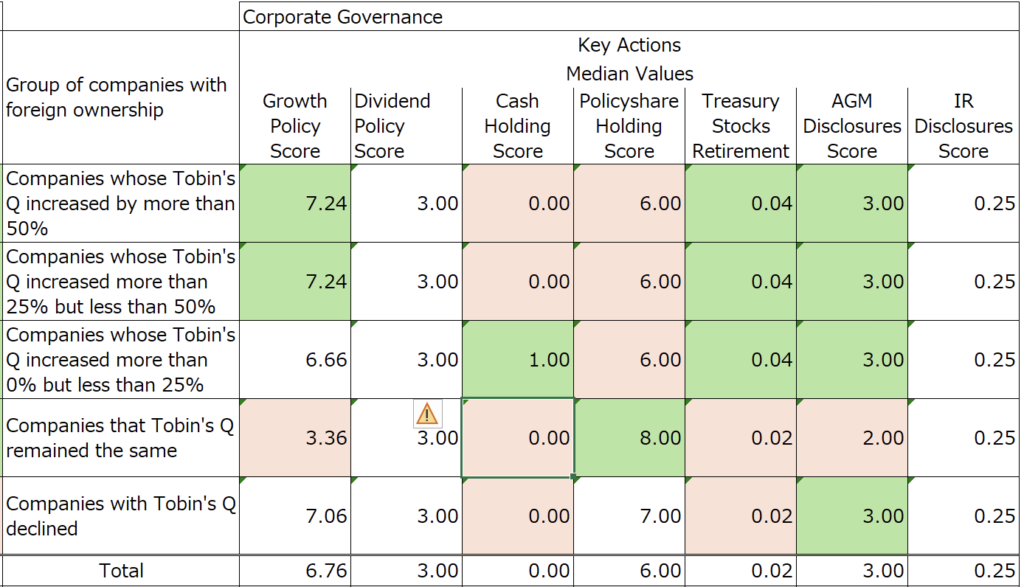
With respect to the percentage change in Tobin’s Q and the characteristics of key actions, the trend is a bit more clear. Companies with Tobin’s Q increases over 50% and companies with Tobin’s Q increases between 25% and 50% have superior Growth Policy Scores, Treasury Stocks Retirement, and AGM Disclosures Score. On the other hand, there is room for improvement in Cash Holding Score and Policyshare Holding Score. These companies have room to improve their return on capital by returning the cash on hand they have accumulated on the back of their high profitability and reducing their policy holdings.
This indicates that although the TSE’s request to raise the P/B attracted attention, many of the companies that increased their Tobin’s Q have traditionally had high Tobin’s Q. And the driver of rising valuations is overseas investors. In addition, companies that have increased their valuations have continuously increased their ROE and ROA. In other words, valuations could not be raised solely on the expectation of P/B improvement without improving profitability. Since companies with higher profitability have more cash on hand, further shareholder returns are expected to have a more positive impact on ROE and ROA.
On the other hand, companies with decreased valuations include companies that are not covered by overseas investors due to their small market capitalization, but some of these companies have relatively high ROE and ROA. They may include small-cap stocks with lower valuations, which may have enhanced investment opportunities.
Furthermore, the median IR Disclosures Score did not differ by the percentage change in Tobin’s Q. This suggests that without earnings power to gain the support of overseas investors, simply expecting higher P/B and stronger IR activity would have limited effect in raising valuations.
http://www.metrical.co.jp/cg-ranking-top100/
Aki Matsumoto, CFA
Please see detail research the following links.
http://www.metrical.co.jp/
Please feel free to contact the below email address if any interest or query.
Aki Matsumoto, CFA
Executive Director
Metrical Inc.
akimatsumoto@metrical.co.jp
http://www.metrical.co.jp/jp-home/
