Following on from my previous articles “How far has corporate governance progressed in 2021 (1)” and “How far has corporate governance progressed in 2021 (2),” I would like to take a look at how far efforts to improve corporate governance at listed companies have progressed in 2021. In this article, I would like to look at how much progress has been made by listed companies in improving corporate governance in 2021.
To briefly summarize the previous two articles, with regard to board practices, I reported that there was little improvement or only limited improvement in the evaluation items that were not specifically mentioned for improvement in the revised Corporate Governance Code, such as board chairmanship, female directors, and anti-takeover measures. In terms of key actions actually taken by listed companies, I reported that the effective use of cash and policy holdings and the clear articulation of growth strategies are likely to continue to be issues this year. Considering the fact that the percentage of foreign shareholders has slightly decreased while stock prices and valuations have risen, I can conclude that the effective use of cash and assets with growth potential may still be an issue, as it may be related to the sluggish growth of ROE and ROA.
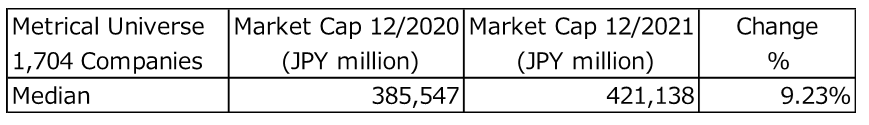
This article will be analyzed in terms of how much each company’s market capitalization has grown. The table below shows the change in market capitalization of the 1,704 companies in the Metrical Universe that are comparable in December 2020 and December 2021. The median market capitalization of the 1,704 companies in the Metrical Universe as of December 2020 was 385,547 million yen, and the median market capitalization of the 1,704 companies in the Metrical Universe as of December 2020 increased to 421,138 million yen, an increase of 9.23% over one year.
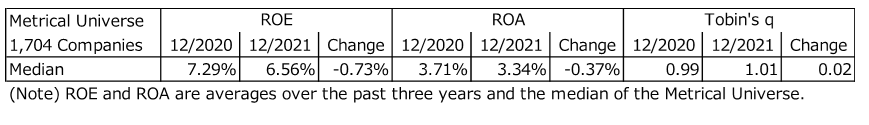
The table below shows the median ROE and ROA of the 1,704 companies in the metrical universe as of December 2020 and December 2021. Since ROE and ROA are averages of the past three years, ROE and ROA as of December 2020 are slightly lower than the previous year, reflecting the performance of FY2020, which was significantly affected by the COVID-19 pandemic. Tobin’s q, on the other hand, has been rising on the back of higher stock prices.
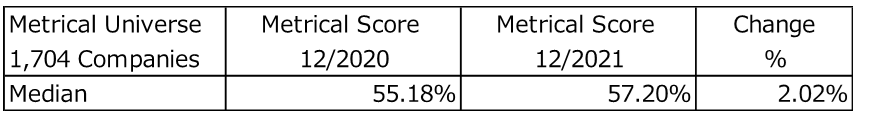
The table below shows the median Metrical Score for the 1,704 companies in the Metrical Universe as of December 2020 and December 2021, where the Metrical Score is an overall evaluation of corporate governance in terms of both board practices and key actions. The median Metrical Score of the 1,704 companies in the Metrical Universe as of December 2020 was 55.18%, and the median Metrical Score of the 1,704 companies in the Metrical Universe as of December 2020 improved to 57.20%. The one-year improvement rate was 2.02 ppt. The one-year improvement rate was 2.02 ppt.
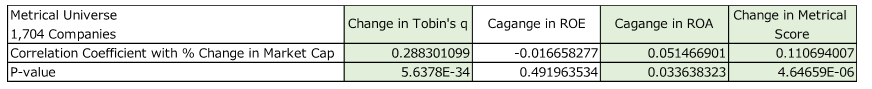
Next, I will analyze the relationship between changes in market capitalization and changes in performance and corporate governance evaluations for the 1,704 companies in the Metrical Universe as of December 2020 and December 2021. The table below shows the correlation between the percentage change in market capitalization and the respective percentage changes in Tobin’s q, ROE, ROA and Metrical score. The analysis has also used the tdist function to show the p-value and check the statistical significance of each correlation coefficient. According to the results, the percentage change in market capitalization as of December 2020 and December 2021 for 1,704 companies in the Metrical universe is positively correlated with the respective percentage changes in Tobin’s q, ROA and Metrical score with significance. While it is natural to understand that the percentage change in market capitalization is correlated with Tobin’s q, it is interesting to note that the positive correlation is more significant with ROA than with ROE. In addition, the positive correlation between the percentage of change in market capitalization and the metrical score is significant, and I feel that the effort of this analysis has been rewarded.
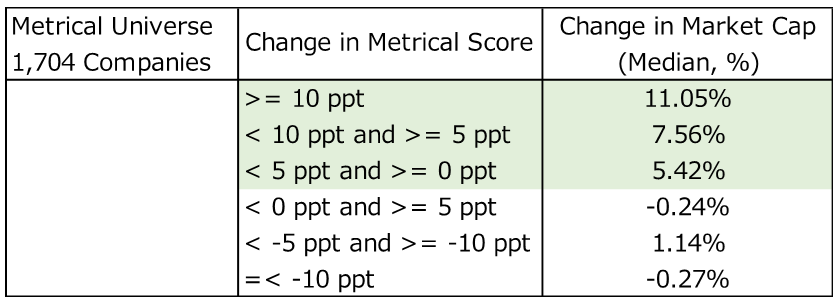
Based on the results of the correlation analysis, which shows that the market capitalization of companies with improved corporate governance practices increased in the December 2020 and December 2021 periods, let’s take the analysis further. The table below shows the percentage increase in market capitalization broken down by the degree of improvement in Metrical score. As the interesting results in the table below show, companies that improved their Metrical score by 10 ppt or more increased their market capitalization the most, followed by companies that improved their Metrical score by 5 ppt or more but less than 10 ppt, and companies that improved their Metrical score by 0 ppt or more but less than 5 ppt. The companies that did not improve their Metrical score did not see a median increase in market capitalization over the period. If the correlation between improved corporate governance practices (including actual company actions) and increased market capitalization holds true, it should provide further support for improved corporate governance practices. I will continue to analyze the results of this study.
Aki Matsumoto, CFA
Executive Director
Metrical Inc.
akimatsumoto@metrical.co.jp
http://www.metrical.co.jp/jp-home/