I would like to take a look at how far efforts to improve corporate governance at listed companies have progressed in 2021. With the April 2022 reorganization of TSE’s market reclassification, the Corporate Governance Code was revised in 2021. As a result, we reconfirmed that the percentage of independent directors and the nomination and compensation committees, which were specifically mentioned as areas for improvement in the revised Corporate Governance Code, have improved. At the same time, efforts to improve the corporate governance of listed companies are also expected to move forward. I would like to have figures to see how far corporate governance has improved as a result of these efforts. In my previous article, I reported that there has been little or limited improvement in the evaluation items that were not specifically mentioned as items to be improved in the revised Corporate Governance Code, such as the chair of the board of directors, female directors, and takeover defense measures.
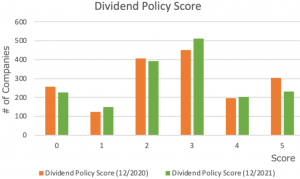
The next chart shows the evaluation of the dividend policy. It evaluates whether a company has a dividend policy, based on the dividend payout as a percentage of net income. The dividend payout ratio is designed so that the higher the ratio, the higher the score, up to a maximum of 50%. We can see that the distribution of the green bars in December 2021 has shifted slightly to the right, where the score is higher, compared to the distribution of the orange bars in December 2020. However, we can see that the score of 3, the dividend payout ratio of 30%, is the highest. Whether this level is appropriate depends on each company’s circumstances, but as mentioned above, given the high level of cash holdings, we cannot deny the possibility that the level of dividends is not sufficient.
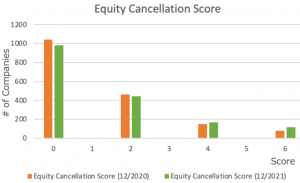
The next chart shows the rating of the stock repurchase. It is designed to rate the frequency of stock repurchases by one, two, or three or more times, with the higher the frequency, the higher the score. We can see that the distribution of the green bars for December 2021 has shifted slightly to the right, where the score is higher, compared to the distribution of the orange bars for December 2020. We can see that the number of companies retiring their own shares is gradually increasing, but the number of companies that have never retired their own shares (score 0) is still very high.
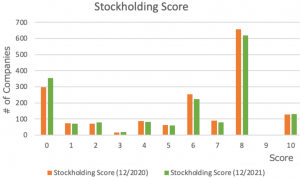
The following chart shows the evaluation of policy stock holdings. The distribution of the green bars in December 2021 is slightly to the right of the higher score compared to the distribution of the orange bars in December 2020, but the change is not significant. Although listed companies continue to reduce their policy stock holdings, including cross-shareholdings, it can be expected that the rise in stock prices has had an impact on the valuation of policy stock shares. In addition, since policy shares are disclosed in the annual securities report following the fiscal year end, the policy shares reduced in the current fiscal year will be reflected in the 2022 disclosure, as most companies will disclose their policy shares in June 2022. We should pay attention to the trend of the reduction of policy stock holdings in the future. On the other hand, if policy shares are reduced, cash will increase, so we should also pay attention to how that cash is used.
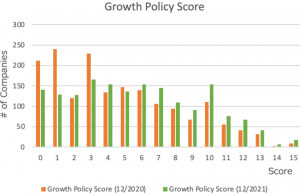
The following chart shows the evaluation of the growth policy. The evaluation is based on whether the company has a mid-term management plan, numerical targets, and whether the KPIs are reasonable and clear considering ROE, ROIC and cost of capital, etc. The higher the evaluation, the higher the score is designed to be. The distribution of the green bars in December 2021 shows a shift to the right with a higher score compared to the distribution of the orange bars in December 2020, and the fact that the TSE’s market reclassification in April 2022 will require companies that cannot meet the listing criteria to disclose their plans for growth is another factor. This is expected to have a positive impact on this score.
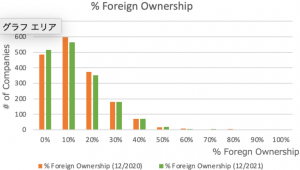
The next chart shows the foreign shareholding ratio. There is no significant change in the foreign shareholding ratio in December 2021 compared to December 2020, but the foreign shareholding ratio appears to have slightly decreased compared to the previous year.
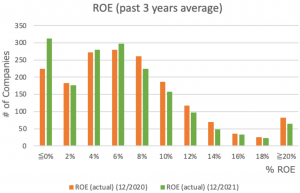
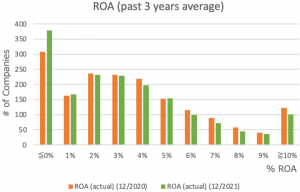
The next two charts show the average distribution of ROE and ROA over the past three years. The distribution itself has not changed significantly, but we can see that the number of companies with ROE below 0% has increased due to the increase in the number of companies with net losses in FY2020, affected by COVID-19 pandemic. On the other hand, the number of companies with ROE in the range of 6% has not changed between December 2020 and December 2021, indicating that ROE has not improved as much as expected.
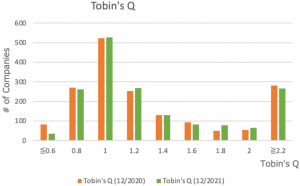
The next chart shows the distribution of Tobin’s Q. Due to the rise in the stock prices, we can see that it rose slightly in December 2021.
The slight decline in the ratio of foreign shareholders amid rising stock prices and valuations may be related to the sluggish growth in ROE and ROA. We have reviewed the evaluation items related to the effective use of cash and assets, but have not been able to identify any clear use that would lead us to expect growth. The effective use of cash and policy shares as well as a clear strategy for growth will continue to be an issue this year.
Aki Matsumoto, CFA
Please see detail research the following links.
http://www.metrical.co.jp/
Please feel free to contact the below email address if any interest or query.
Aki Matsumoto, CFA
Executive Director
Metrical Inc.
akimatsumoto@metrical.co.jp
http://www.metrical.co.jp/jp-home/